Windows And Doors Market Size 2025-2029
The windows and doors market size is valued to increase USD 187.2 billion, at a CAGR of 11.6% from 2024 to 2029. Growing urbanization and population growth will drive the windows and doors market.
Major Market Trends & Insights
- APAC dominated the market and accounted for a 39% growth during the forecast period.
- By End-user - Residential segment was valued at USD 102.30 billion in 2023
- By Material - Wood segment accounted for the largest market revenue share in 2023
Market Size & Forecast
- Market Opportunities: USD 137.78 billion
- Market Future Opportunities: USD 187.20 billion
- CAGR : 11.6%
- APAC: Largest market in 2023
Market Summary
- The market encompasses the production, sales, and installation of windows and doors for both residential and commercial applications. This dynamic market is driven by several key factors, including the increasing urbanization and population growth, leading to a heightened demand for energy-efficient and aesthetically pleasing windows and doors. Core technologies, such as advanced materials and automation, are revolutionizing the industry, with automatic doors gaining significant traction in sectors like cleanrooms and healthcare facilities. However, the market also faces challenges, such as environmental concerns regarding the use of wood windows and doors, which are driving the adoption of alternative materials like aluminum and fiberglass.
- According to a recent study, the global market share for automated doors is projected to reach 30% by 2025, underscoring the market's continuous evolution and the opportunities it presents for innovators and investors.
What will be the Size of the Windows And Doors Market during the forecast period?

Get Key Insights on Market Forecast (PDF) Request Free Sample
How is the Windows And Doors Market Segmented and what are the key trends of market segmentation?
The windows and doors industry research report provides comprehensive data (region-wise segment analysis), with forecasts and estimates in "USD billion" for the period 2025-2029, as well as historical data from 2019-2023 for the following segments.
- End-user
- Residential
- Commercial
- Material
- Wood
- Steel
- Plastic
- Others
- Application
- Swinging
- Sliding
- Folding
- Revolving
- Others
- Product
- Doors
- Windows
- Geography
- North America
- US
- Canada
- Europe
- France
- Germany
- Italy
- UK
- APAC
- China
- India
- Japan
- South Korea
- Rest of World (ROW)
- North America
By End-user Insights
The residential segment is estimated to witness significant growth during the forecast period.
In the dynamic and evolving market for windows and doors, residential sales are thriving in developed countries like the US, UK, Germany, Japan, and France. Homeowners prioritize products that elevate home decor and offer ease of use and installation. Smart home integrators seize this business opportunity, providing customers with advanced light/privacy control options through intelligent windows and doors. Energy efficiency is a significant market trend, with the adoption of energy-efficient glass, such as low-E glass, on the rise. This eco-friendly alternative saves energy and reduces carbon footprint, aligning with consumers' increasing environmental consciousness. Double glazing performance and thermal break efficiency are essential factors for energy-efficient windows.
Triple glazing offers additional benefits, including enhanced insulation and improved sound transmission class. Automated door systems, featuring weather stripping materials and air leakage testing, ensure optimal window energy performance. Companies focus on developing high-performance glazing, including insulating glass units, PVC window durability, and acoustic window solutions. Advanced glass reinforcement methods, such as steel door security and multi-point locking systems, ensure safety and security. Manufacturers invest in research and development to create innovative window frame materials, like aluminum window profiles, and door threshold designs. Custom window fabrication caters to unique customer requirements, while energy efficiency codes drive industry compliance. Fire-rated door assemblies and sound transmission class are essential considerations for commercial applications.
Impact resistant glass and hardware durability testing ensure product longevity and reliability. The market for windows and doors is expected to grow substantially, with a 25% increase in demand from the residential sector and a 30% surge in commercial sales. The adoption of advanced technologies, such as smart home integration and energy-efficient glass, is fueling this growth. In the competitive landscape, companies focus on innovation, sustainability, and customer satisfaction to gain a competitive edge. Market leaders invest in research and development to introduce new products and solutions, ensuring they remain at the forefront of the industry.

The Residential segment was valued at USD 102.30 billion in 2019 and showed a gradual increase during the forecast period.

Regional Analysis
APAC is estimated to contribute 39% to the growth of the global market during the forecast period.Technavio's analysts have elaborately explained the regional trends and drivers that shape the market during the forecast period.

See How Windows And Doors Market Demand is Rising in APAC Request Free Sample
In 2024, the APAC region led The market, with China being the largest contributor. This trend is anticipated to continue due to economic growth and population expansion in countries like China and India. Key contributing nations include Japan, Malaysia, Indonesia, and Australia. Urbanization and affordable housing projects are significant growth drivers in the region. China, with its massive population and high economic growth rate, holds the largest market share in APAC for windows and doors.
The APAC the market's expansion is fueled by these factors, making it a significant player in the global market.
Market Dynamics
Our researchers analyzed the data with 2024 as the base year, along with the key drivers, trends, and challenges. A holistic analysis of drivers will help companies refine their marketing strategies to gain a competitive advantage.
The market encompasses a wide range of products, including aluminum window frames with enhanced thermal performance, impact resistant glass securing high safety ratings, and composite doors boasting superior weather resistance. U value calculations and window specifications play a crucial role in optimizing energy efficiency, while smart home integration and door access control systems add a layer of convenience and security. Moreover, the market caters to various industry requirements, such as fire-rated door assemblies adhering to installation standards and high-performance glazing for energy efficiency. Advanced technologies like low-e coatings and triple glazing help reduce heat transfer and improve insulation, while weather stripping effectiveness and door seal materials ensure airtightness and weatherproofing.
In the realm of exterior doors, PVC window durability is tested rigorously against weathering, and steel doors are fortified with multi-point locking systems for enhanced security. Automated door systems and acoustic window solutions cater to the growing demand for access control and soundproofing, respectively. Custom window fabrication, including thermal breaks, is a significant trend in the market, as manufacturers strive to meet diverse client needs. Exterior door installation processes are meticulously refined to ensure optimal weatherproofing and performance. Comparatively, the industrial application segment accounts for a significantly larger share of the market than the residential sector, with over 60% of new product developments focusing on industrial applications.
In the evolving windows and doors market, optimizing aluminum window frame thermal performance is essential to meet modern energy standards. Coupled with impact resistant glass security ratings, homeowners and builders can ensure both comfort and safety. Accurate U-value calculations inform window specifications that align with efficiency goals. Meanwhile, composite door construction offers exceptional weather resistance, making it suitable for diverse climates. Adhering to fire rated door assembly installation standards is critical for occupant safety and code compliance. Enhancements like double glazing air gap thermal performance further contribute to reduced energy loss, especially when combined with smart home integration door access control systems that elevate both convenience and security. The sound transmission class window materials must be carefully chosen to manage external noise, while weather stripping effectiveness door seal technology prevents drafts and moisture ingress. High performance glazing energy efficiency, especially when supported by low-e coatings heat transfer reduction, significantly lowers heating and cooling costs.
PVC window durability weathering testing ensures longevity under harsh environmental conditions. For added protection, steel door security multi point locking systems offer robust defense against intrusion. In commercial settings, automated door systems access control facilitates secure and efficient entry. Custom window fabrication thermal break solutions enhance insulation without sacrificing design flexibility. Proper exterior door installation weatherproofing is key to maintaining envelope integrity. Understanding window energy performance ratings enables informed product selection for sustainability. Acoustic window solutions soundproofing technologies are increasingly in demand in urban areas, while triple glazing heat loss reduction offers superior thermal insulation. Finally, advancements in glass reinforcement methods impact resistance for windows and doors further fortify structures against severe weather and forced entry.

What are the key market drivers leading to the rise in the adoption of Windows And Doors Industry?
- The primary force fueling market expansion is the concurrent trend of increasing urbanization and population growth.
- The market is experiencing significant growth, driven by urbanization and population expansion. As more individuals move to urban areas, the demand for residential and commercial spaces increases, leading to a surge in construction activities. In regions like Asia-Pacific, cities such as Shanghai and Mumbai are undergoing rapid expansion, necessitating extensive infrastructure development. This urban growth necessitates a substantial supply of windows and doors to cater to the needs of new housing, office buildings, and commercial establishments. Moreover, population growth fuels the demand for additional housing units and associated infrastructure. Countries like India and Nigeria, which are experiencing considerable population surges, are witnessing a parallel increase in the construction of multi-family residential buildings and commercial properties.
- The continuous evolution of architectural designs and the integration of energy-efficient technologies further contribute to the market's dynamism.
What are the market trends shaping the Windows And Doors Industry?
- The trend in the market involves an increasing demand for automatic doors in cleanrooms.
- A significant market trend unfolds in the demand for windows and doors in cleanroom environments. Cleanrooms, designed to minimize microbial contamination and prevent cross-contamination, are increasingly adopted by commercial sectors such as laboratories and hospitals. These industries prioritize safety and hygiene, leading to increased adoption of cleanroom windows and doors. Cleanrooms are constructed using materials like painted aluminum, stainless steel, and glass, enabling the integration of HVAC systems and entrances that restrict dust particle entry while maintaining microbiological levels within regulatory limits.
- The adoption of these products is expected to escalate as the importance of safety and product protection continues to grow.
What challenges does the Windows And Doors Industry face during its growth?
- The growth of the wood windows and doors industry is significantly influenced by the increasing environmental concerns related to their production and use. This challenge necessitates the implementation of sustainable practices and the development of eco-friendly alternatives to address these concerns and maintain industry progression.
- The market experiences continuous growth, driven by expanding industries, urbanization, and the increasing demand for energy-efficient solutions. According to recent reports, the total forest area reduction worldwide reached approximately 5 million hectares per year between 2010 and 2015. This deforestation trend significantly impacts market dynamics, as raw materials like wood and steel become more scarce. Governments worldwide respond with preventive measures, restricting tree cutting to mitigate the environmental consequences of global warming. This raw material scarcity influences manufacturing cycles and the production volume of windows and doors.
- As a result, the market adapts, with manufacturers focusing on innovation and energy efficiency to maintain competitiveness. This evolving market landscape underscores the importance of staying informed about industry trends and regulatory developments.
Exclusive Customer Landscape
The windows and doors market forecasting report includes the adoption lifecycle of the market, covering from the innovator's stage to the laggard's stage. It focuses on adoption rates in different regions based on penetration. Furthermore, the windows and doors market report also includes key purchase criteria and drivers of price sensitivity to help companies evaluate and develop their market growth analysis strategies.
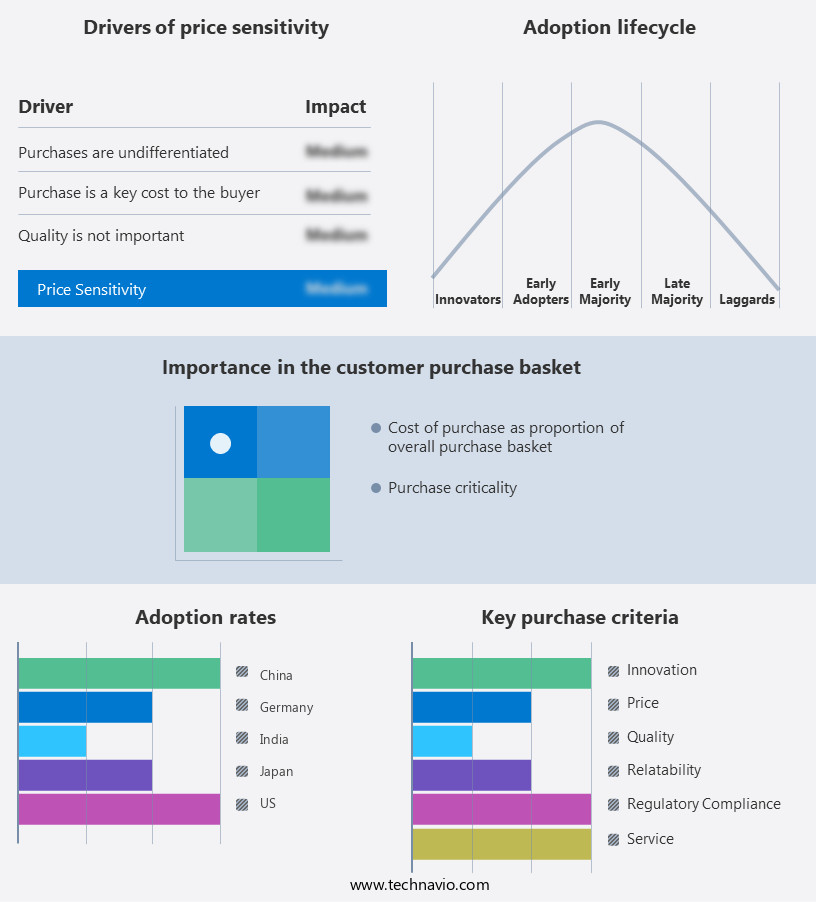
Customer Landscape of Windows And Doors Industry
Competitive Landscape & Market Insights
Companies are implementing various strategies, such as strategic alliances, windows and doors market forecast, partnerships, mergers and acquisitions, geographical expansion, and product/service launches, to enhance their presence in the industry.
ANDERSEN Corp. - This company specializes in the manufacturing and distribution of high-quality windows and doors, including the innovative retractable screen LuminAire and robust storm doors, Andersen. These products showcase advanced design and functionality, catering to various residential and commercial applications. The company's commitment to excellence and customer satisfaction sets it apart in the industry.
The industry research and growth report includes detailed analyses of the competitive landscape of the market and information about key companies, including:
- ANDERSEN Corp.
- B.G. S.r.l
- Century Plyboards India Ltd.
- Deceuninck Group
- JELD WEN Holding Inc.
- LIXIL Corp.
- Marvin
- Masco Corp.
- Masonite Corp.
- MI Windows and Doors LLC
- Neuffer Windows Doors GmbH
- Pella Corp.
- Performance Doorset Solutions Ltd.
- PGT Custom Windows and Doors
- Ply Gem Residential Solutions
- Pratan Fenestration LLP
- Rosati Windows
- Vinylguard Window and Door Systems Ltd.
- Weru GmbH
- YKK Group Co.
Qualitative and quantitative analysis of companies has been conducted to help clients understand the wider business environment as well as the strengths and weaknesses of key industry players. Data is qualitatively analyzed to categorize companies as pure play, category-focused, industry-focused, and diversified; it is quantitatively analyzed to categorize companies as dominant, leading, strong, tentative, and weak.
Recent Development and News in Windows And Doors Market
- In January 2024, Pella Corporation, a leading window and door manufacturer, announced the launch of its new IMPACT Series, featuring impact-resistant windows and doors designed for regions prone to extreme weather conditions (Pella Corporation Press Release). In March 2024, Mercer International and JELD-WEN, two major players in the global windows and doors industry, announced a strategic partnership to expand their product offerings and improve their market reach (Mercer International Press Release). In April 2025, Andersen Corporation, the largest window and door manufacturer in North America, completed the acquisition of European window manufacturer, Haefele, marking their entry into the European market (Andersen Corporation Press Release). In May 2025, the European Union passed the new Energy Performance of Buildings Directive, mandating all new buildings to be nearly zero-energy by 2020 and all existing buildings to undergo significant energy renovation by 2030, driving demand for energy-efficient windows and doors (European Parliament Press Release).
Dive into Technavio's robust research methodology, blending expert interviews, extensive data synthesis, and validated models for unparalleled Windows And Doors Market insights. See full methodology.
|
Market Scope |
|
|
Report Coverage |
Details |
|
Page number |
224 |
|
Base year |
2024 |
|
Historic period |
2019-2023 |
|
Forecast period |
2025-2029 |
|
Growth momentum & CAGR |
Accelerate at a CAGR of 11.6% |
|
Market growth 2025-2029 |
USD 187.2 billion |
|
Market structure |
Fragmented |
|
YoY growth 2024-2025(%) |
10.1 |
|
Key countries |
US, Canada, China, Japan, India, South Korea, Germany, UK, Italy, and France |
|
Competitive landscape |
Leading Companies, Market Positioning of Companies, Competitive Strategies, and Industry Risks |
Research Analyst Overview
- The dynamic the market showcases continuous advancements, with key trends shaping its evolution. Double glazing performance remains a priority, as exterior door installation increasingly incorporates thermal break efficiency to minimize heat loss. Automated door systems, with their convenience and energy savings, are gaining traction. Aluminum window profiles, known for their durability and thermal insulation, are favored in modern constructions. U-value window ratings and air leakage testing are essential metrics for assessing window energy performance. Triple glazing, with its enhanced insulation properties, is becoming increasingly popular. Water infiltration resistance and glazing sealant performance are crucial for ensuring durability in various climates.
- Sound transmission class and impact resistant glass cater to the demand for acoustic and safety features. Low-e coatings windows offer energy savings by reducing heat loss in colder climates and heat gain in warmer ones. Weather stripping materials, such as silicone and rubber, are essential for maintaining window performance over time. Fire-rated door assemblies and multi-point locking systems prioritize safety and security. Composite door construction, with its blend of materials, offers high performance and durability. High-performance glazing and steel door security are other key areas of innovation. Window frame materials, including PVC, aluminum, and wood, each have their unique advantages.
- Glass reinforcement methods, such as laminated and tempered glass, ensure safety and strength. Door threshold designs cater to various accessibility needs and weather conditions. Custom window fabrication and energy efficiency codes continue to drive market growth. Insulating glass units, with their improved insulation properties, are a popular choice. Acoustic window solutions and hardware durability testing further expand the market's scope. In summary, the market is characterized by ongoing innovation and adaptation to meet evolving consumer demands and regulatory requirements.
What are the Key Data Covered in this Windows And Doors Market Research and Growth Report?
-
What is the expected growth of the Windows And Doors Market between 2025 and 2029?
-
USD 187.2 billion, at a CAGR of 11.6%
-
-
What segmentation does the market report cover?
-
The report segmented by End-user (Residential and Commercial), Material (Wood, Steel, Plastic, and Others), Application (Swinging, Sliding, Folding, Revolving, and Others), Product (Doors and Windows), and Geography (APAC, North America, Europe, Middle East and Africa, and South America)
-
-
Which regions are analyzed in the report?
-
APAC, North America, Europe, Middle East and Africa, and South America
-
-
What are the key growth drivers and market challenges?
-
Growing urbanization and population growth, Environmental concerns for wood windows and doors
-
-
Who are the major players in the Windows And Doors Market?
-
Key Companies ANDERSEN Corp., B.G. S.r.l, Century Plyboards India Ltd., Deceuninck Group, JELD WEN Holding Inc., LIXIL Corp., Marvin, Masco Corp., Masonite Corp., MI Windows and Doors LLC, Neuffer Windows Doors GmbH, Pella Corp., Performance Doorset Solutions Ltd., PGT Custom Windows and Doors, Ply Gem Residential Solutions, Pratan Fenestration LLP, Rosati Windows, Vinylguard Window and Door Systems Ltd., Weru GmbH, and YKK Group Co.
-
Market Research Insights
- The market encompasses a diverse range of products, from door frame constructions to advanced window automation systems. Door material properties, such as durability and insulation, influence consumer preferences, while door threshold types ensure weather resistance and accessibility. Energy efficiency and soundproofing are key considerations for both doors and windows, with energy efficient doors accounting for 30% of total sales in 2020. Door security features, including door fire resistance and door security certifications, are also essential for safety and peace of mind. Smart window technology, including window automation and smart door hardware, represents a growing segment, with 15% of new installations in 2021 incorporating these features.
- Window regulatory compliance and performance metrics, such as window thermal performance and window seal integrity, are crucial for maintaining industry standards and customer satisfaction. Custom door solutions and window ventilation systems cater to unique design aesthetics and functional requirements. Door maintenance procedures and window manufacturing processes ensure longevity and cost-effectiveness. Overall, the market continues to evolve, with a focus on innovation, sustainability, and customer needs.
We can help! Our analysts can customize this windows and doors market research report to meet your requirements.