Wireless Sensors Market Analysis North America, APAC, Europe, South America, Middle East and Africa - US, China, Japan, Germany, UK - Size and Forecast 2024-2028

Wireless Sensors Market Analysis North America, APAC, Europe, South America, Middle East and Africa - US, China, Japan, Germany, UK - Size and Forecast 2024-2028

Published: Mar 2024 177 Pages SKU: IRTNTR77681

Market Overview at a Glance

$28.87 B
Market Opportunity
18.02%
CAGR
17.06
YoY growth 2023-2024(%)

Wireless Sensors Market Size 2024-2028 

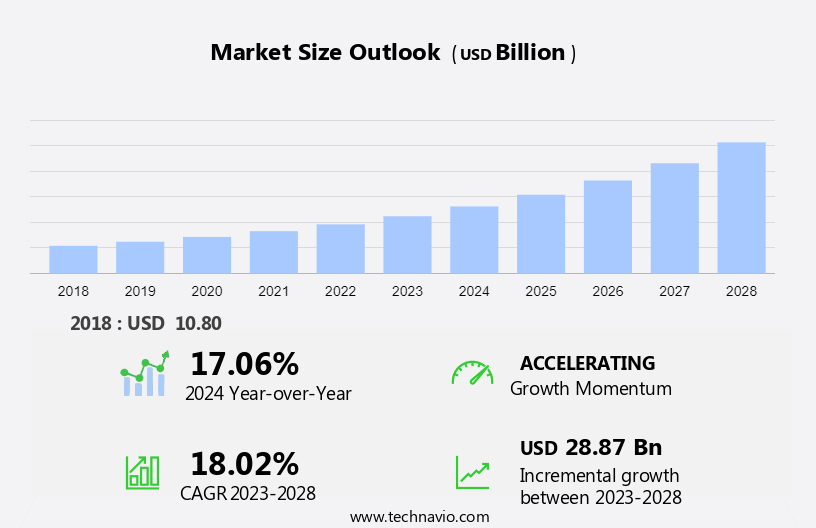
The wireless sensors market size is forecast to increase by USD 28.87 billion at a CAGR of 18.02% between 2023 and 2028. The market is experiencing significant growth, driven by the increasing adoption of Industry 4.0 and the Internet of Things (IoT) in various industries. The integration of wireless sensors in manufacturing processes enables real-time monitoring, predictive maintenance, and improved efficiency, making it a crucial component of Industry 4.0. Additionally, emerging wearable technologies are fueling the demand for wireless sensors in healthcare, fitness, and wellness applications. Moreover, technological advancements in telemedicine and telehealth platforms enable continuous monitoring of hypopnea-related events, respiratory rate, and snoring in patients with sleep apnea using wireless devices like smartwatches and smartphones. However, delivering high-quality wireless sensor networks at low costs remains a significant challenge. The market trends include the development of long-range, low-power wireless technologies, the integration of advanced analytics and machine learning algorithms, and the increasing use of cloud-based platforms for data processing and storage.

Wireless Sensors Market Size

 Request Free Sample

The market is witnessing significant growth due to the increasing adoption of IoT technology and the proliferation of connected devices. These sensors, which include battery-operated motes and sensor nodes, use wireless networks to transmit data. They find applications in various sectors such as Industrial automation, Smart grids, Smart homes, and Smart cities. Zero-power wireless sensors are gaining popularity due to their extended battery life and low power consumption. The market is also driven by the growing demand for data monitoring in various industries, including Energy sources and Renewable energy. Wireless sensors are used in RFID and Bluetooth applications for data monitoring and remote monitoring.

Furthermore, the market for wireless sensors is vast and diverse, with applications ranging from PC peripherals and remote controls to Self-driving cars and Electric cars. The market is expected to grow at a rapid pace in the coming years, driven by the increasing demand for wireless sensors in IoT applications, Smart homes, and Smart cities. Wireless sensors are used in various industries, including Industrial automation, Smart grids, and Building automation, to monitor and control various processes. They are also used in Hydraulic brakes and connected devices for data monitoring and remote monitoring. The market for wireless sensors in the automotive industry is expected to grow rapidly due to the increasing demand for safety and efficiency in electric cars and Self-driving cars.

Market Segmentation

The market research report provides comprehensive data (region-wise segment analysis), with forecasts and estimates in "USD billion" for the period 2024-2028, as well as historical data from 2018-2022 for the following segments.

  • End-user
    • Building automation
    • Wearable devices
    • Healthcare
    • Automotive and transportation
    • Others
  • Component
    • Hardware
    • Software
    • Services
  • Geography
    • North America
      • US
    • APAC
      • China
      • Japan
    • Europe
      • Germany
      • UK
    • South America
    • Middle East and Africa

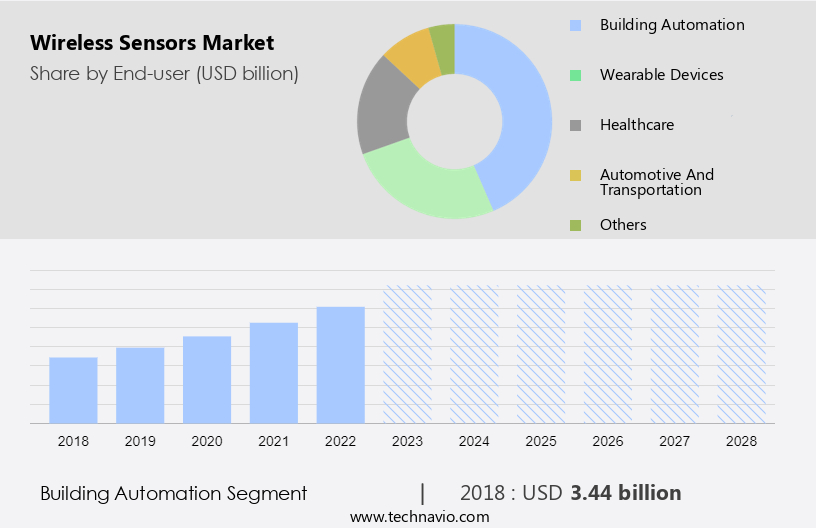
By End-user Insights

The building automation segment is estimated to witness significant growth during the forecast period. Wireless sensors play a pivotal role in various industries, including workforce safety in mining and oil & gas, energy transmission, and facility management. In the energy sector, these sensors enable condition monitoring of machinery and equipment, reducing carbon footprint and enhancing energy efficiency. Wireless sensors are deployed in stationary weather conditions for energy processing and in portable weather conditions for wind energy systems, weather stations, and building design aerodynamics. Vicotee, a Norwegian startup, and Everactive are among the wireless sensor manufacturers providing battery-free wireless sensors for applications such as cold chain refrigerator monitoring, asset tracking, and smart agriculture. Vicotee Cloud offers IoT solutions for smokestack mercury sampling, automotive emissions, and water pollution devices.

Moreover, the collaborations have led to advancements in low-power management and wired electrical infrastructure. In the context of building automation systems (BASs), wireless sensors are essential for monitoring and controlling heating, ventilation, and air conditioning (HVAC), managing facilities (lighting, security, and access), and automating electric meter readings. Companies like Honeywell International Inc. And Philips Hue (Koninklijke Philips N.V.) provide wireless thermostats and sensors for precise HVAC system monitoring and optimization. Motion sensors from Philips Hue and Lutron (Lutron Electronics Co.) enable real-time HVAC and lighting adjustments, ensuring energy conservation and enhancing overall efficiency.

Wireless Sensors Market Size

Get a glance at the market share of various segments Request Free Sample

The building automation segment was valued at USD 3.44 billion in 2018 and showed a gradual increase during the forecast period.

Regional Insights

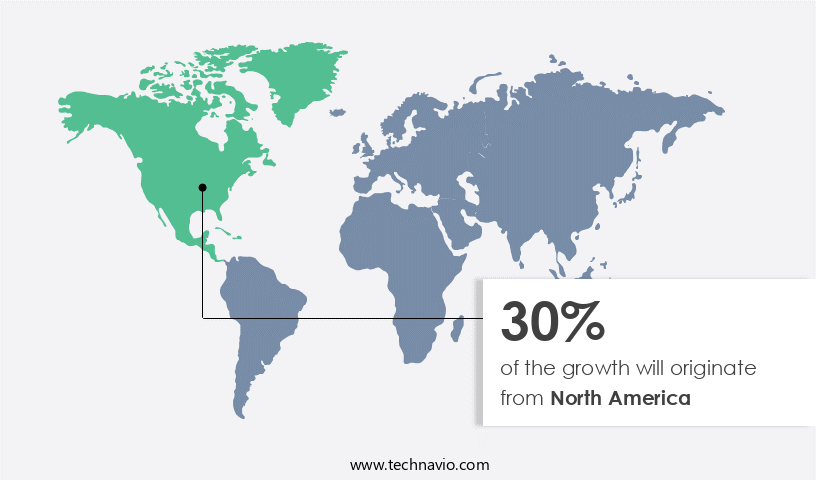
North America is estimated to contribute 30% to the growth of the global market during the forecast period. Technavio's analysts have elaborately explained the regional trends and drivers that shape the market during the forecast period.

Wireless Sensors Market Share by Geography

For more insights on the market share of various regions Request Free Sample

In the market, North America led with a significant share in 2023, primarily driven by the US, which is a major manufacturing hub with a strong presence in industries such as energy transmission, mining, oil & gas, and manufacturing. The region's focus on Industrial Internet of Things (IoT) adoption has resulted in the integration of wireless sensor technologies in various sectors like healthcare, agriculture, and smart cities for enhanced efficiency and data-driven decision-making. The US, in particular, is known for its advancements in IoT, making it a significant contributor to the market's growth. Wireless sensors play a crucial role in various industries, including energy processing, where they are used for condition monitoring and low power management in wind energy systems, weather stations, and building design aerodynamics.

Furthermore, in the energy sector, these sensors help minimize carbon footprint and optimize energy usage. In the manufacturing sector, they are used for machinery and equipment monitoring, asset tracking, and smart agriculture. Key wireless sensor manufacturers are leading the market with innovative solutions. Everactive's battery-free wireless sensors and Vicotee's Cloud-based monitoring system are notable examples. These solutions are being implemented in diverse applications, such as cold chain refrigerator monitoring, smokestack mercury sampling, and smart waste management. The Caribbean region is also witnessing growth in the market, with applications in weather conditions monitoring for hurricane warnings and asset tracking for logistics management.

Overall, the market is expected to continue its growth trajectory, driven by the increasing demand for real-time data and automation in various industries.

Our researchers analyzed the data with 2023 as the base year, along with the key drivers, trends, and challenges. A holistic analysis of drivers will help companies refine their marketing strategies to gain a competitive advantage.

Market Driver

Increasing adoption of Industry 4.0 is the key driver of the market. The market is experiencing significant growth due to the implementation of Industry 4.0, which integrates digital technologies into manufacturing processes. This revolution aims to create smart factories where machines, systems, and processes collaborate in real-time, leading to increased efficiency, productivity, and data-driven decision-making. NOVELDA's wireless sensors play a pivotal role in this transformation, offering connectivity and real-time data for smart manufacturing.

Furthermore, these sensors are utilized extensively throughout the manufacturing process to monitor and collect data on various parameters such as temperature, humidity, pressure, and equipment status. By enabling predictive maintenance, optimizing energy usage, increasing overall equipment efficiency (OEE), and facilitating quick responses to production changes, wireless sensors contribute significantly to the smart factory concept. The power-saving mechanism integrated into these sensors further enhances their appeal, ensuring extended battery life and reduced maintenance costs.

Market Trends

Emerging wearable technologies is the upcoming trend in the market. The market is witnessing significant growth due to the increasing popularity of wearable devices that enhance people's daily lives worldwide. These devices, which include smartwatches, Google Glass-like smart glasses, smart fabrics, heart rate monitors, and fitness trackers are essentially mobile communication technologies that can be attached to a body part.

Furthermore, magnetic sensor manufacturers are innovating by developing micro-electromechanical systems (MEMS) sensors to support these wearable technologies. In the medical field, the adoption of novel sensors has led to advancements in disease detection, such as breast cancer.

Market Challenge

The growing challenge of delivering high-quality wireless sensor networks at low cost is a key challenge affecting the market growth. The market encounters hurdles in providing top-tier networks at economical prices, thereby impeding their extensive utilization. One of the major obstacles is the expense of manufacturing elements for sophisticated wireless sensors, including accurate sensors, reliable communication modules, and power-efficient processors, which influences the affordability of implementing sensor networks.

Furthermore, another challenge lies in achieving a fine equilibrium between energy conservation and strong functionality, as numerous wireless sensors operate on battery power, necessitating prolonged battery life for applications in secluded or inaccessible environments. Furthermore, security becomes a paramount concern as wireless sensor networks expand, necessitating strong security measures to safeguard data transmission without incurring excessive costs, which market participants are continually addressing through innovative solutions.

Exclusive Customer Landscape

The market forecasting report includes the adoption lifecycle of the market, covering from the innovator's stage to the laggard's stage. It focuses on adoption rates in different regions based on penetration. Furthermore, the report also includes key purchase criteria and drivers of price sensitivity to help companies evaluate and develop their market growth analysis strategies.

Wireless Sensors Market Share by Geography

 Customer Landscape

Key Companies & Market Insights

Companies are implementing various strategies, such as strategic alliances, partnerships, mergers and acquisitions, geographical expansion, and product/service launches, to enhance their presence in the market.

Analog Devices Inc.: The company offers wireless sensor solutions that consist of spatially distributed autonomous sensors to monitor physical or environmental conditions, such as temperature, sound, vibration, pressure, humidity, motion, or pollutants.

The market research and growth report includes detailed analyses of the competitive landscape of the market and information about key companies, including:

  • ABB Ltd.
  • ADT Inc.
  • Advantech Co. Ltd.
  • Emerson Electric Co.
  • General Electric Co.
  • Honeywell International Inc.
  • Infineon Technologies AG
  • Koninklijke Philips N.V.
  • Laird Connectivity
  • Legrand SA
  • Libelium Comunicaciones Distribuidas SL
  • Lutron Electronics Co. Inc.
  • Microchip Technology Inc.
  • NXP Semiconductors NV
  • Renesas Electronics Corp.
  • Robert Bosch GmbH
  • Schneider Electric SE
  • Sensata Technologies Inc.
  • Siemens AG
  • Somfy SA
  • STMicroelectronics International NV
  • TE Connectivity Ltd.
  • Texas Instruments Inc.
  • Yokogawa Electric Corp.
  • Broadcom Inc.

Qualitative and quantitative analysis of companies has been conducted to help clients understand the wider business environment as well as the strengths and weaknesses of key market players. Data is qualitatively analyzed to categorize companies as pure play, category-focused, industry-focused, and diversified; it is quantitatively analyzed to categorize companies as dominant, leading, strong, tentative, and weak.

Research Analyst Overview

Wireless sensors have revolutionized various industries by enabling real-time data monitoring and management. These sensors, which include battery-operated motes and sensor nodes, communicate wirelessly through networks such as Bluetooth, Wireless Fidelity (Wi-Fi), Cellular Network, and RFID. The IoT era has significantly increased the demand for wireless sensors in sectors like smart transportation, military surveillance, machine monitoring, patient monitoring, smart grids, industrial automation, smart homes, smart cities, and more. Hardware components play a crucial role in the functionality and efficiency of wireless sensors. Technologies like MEMS sensors, LED sensors, flow sensors, and RFID are integral to specific applications.

Furthermore, zero-power wireless sensors are gaining popularity due to their energy efficiency, with applications in various sectors like renewable energy, building automation, and power lines. The integration of wireless sensors in electric cars and self-driving cars is another significant development, enhancing safety and performance. Wireless sensors are transforming industries, from manufacturing and healthcare to transportation and energy, by providing data monitoring capabilities for connected devices, transformers, power lines, and IoT-connected devices. The future of wireless sensors looks promising, with advancements in technology and increasing demand for smart solutions.

Market Scope

Report Coverage

Details

Page number

177

Base year

2023

Historic period

2018-2022

Forecast period

2024-2028

Growth momentum & CAGR

Accelerate at a CAGR of 18.02%

Market growth 2024-2028

USD 28.87 billion

Market structure

Fragmented

YoY growth 2023-2024(%)

17.06

Regional analysis

North America, APAC, Europe, South America, and Middle East and Africa

Performing market contribution

North America at 30%

Key countries

US, China, Japan, Germany, and UK

Competitive landscape

Leading Companies, Market Positioning of Companies, Competitive Strategies, and Industry Risks

Key companies profiled

ABB Ltd., ADT Inc., Advantech Co. Ltd., Analog Devices Inc., Emerson Electric Co., General Electric Co., Honeywell International Inc., Infineon Technologies AG, Koninklijke Philips N.V., Laird Connectivity, Legrand SA, Libelium Comunicaciones Distribuidas SL, Lutron Electronics Co. Inc., Microchip Technology Inc., NXP Semiconductors NV, Renesas Electronics Corp., Robert Bosch GmbH, Schneider Electric SE, Sensata Technologies Inc., Siemens AG, Somfy SA, STMicroelectronics International NV, TE Connectivity Ltd., Texas Instruments Inc., Yokogawa Electric Corp., and Broadcom Inc.

Market dynamics

Parent market analysis, market growth inducers and obstacles, market forecast, fast-growing and slow-growing segment analysis, COVID-19 impact and recovery analysis and future consumer dynamics, market condition analysis for the forecast period

Customization purview

If our market report has not included the data that you are looking for, you can reach out to our analysts and get segments customized.

Request Free Sample

What are the Key Data Covered in this Market Research and Growth Report?

  • CAGR of the market during the forecast period
  • Detailed information on factors that will drive the market growth and forecasting between 2024 and 2028
  • Precise estimation of the size of the market  and its contribution of the market in focus to the parent market
  • Accurate predictions about upcoming market growth and trends and changes in consumer behaviour
  • Growth of the market across North America, APAC, Europe, South America, and Middle East and Africa
  • Thorough analysis of the market's competitive landscape and detailed information about companies
  • Comprehensive analysis of factors that will challenge the growth of market companies

We can help! Our analysts can customize this market research report to meet your requirements. Get in touch

1 Executive Summary

  • 1.1 Market overview
    • Exhibit 01: Executive Summary – Chart on Market Overview
    • Exhibit 02: Executive Summary – Data Table on Market Overview
    • Exhibit 03: Executive Summary – Chart on Global Market Characteristics
    • Exhibit 04: Executive Summary – Chart on Market by Geography
    • Exhibit 05: Executive Summary – Chart on Market Segmentation by End-user
    • Exhibit 06: Executive Summary – Chart on Market Segmentation by Component
    • Exhibit 07: Executive Summary – Chart on Incremental Growth
    • Exhibit 08: Executive Summary – Data Table on Incremental Growth
    • Exhibit 09: Executive Summary – Chart on Vendor Market Positioning

2 Market Landscape

  • 2.1 Market ecosystem
    • Exhibit 10: Parent market
    • Exhibit 11: Market Characteristics

3 Market Sizing

  • 3.1 Market definition
    • Exhibit 12: Offerings of vendors included in the market definition
  • 3.2 Market segment analysis
    • Exhibit 13: Market segments
  • 3.3 Market size 2023
    • 3.4 Market outlook: Forecast for 2023-2028
      • Exhibit 14: Chart on Global - Market size and forecast 2023-2028 ($ billion)
      • Exhibit 15: Data Table on Global - Market size and forecast 2023-2028 ($ billion)
      • Exhibit 16: Chart on Global Market: Year-over-year growth 2023-2028 (%)
      • Exhibit 17: Data Table on Global Market: Year-over-year growth 2023-2028 (%)

    4 Historic Market Size

    • 4.1 Global wireless sensors market 2018 - 2022
      • Exhibit 18: Historic Market Size – Data Table on global wireless sensors market 2018 - 2022 ($ billion)
    • 4.2 End-user Segment Analysis 2018 - 2022
      • Exhibit 19: Historic Market Size – End-user Segment 2018 - 2022 ($ billion)
    • 4.3 Component Segment Analysis 2018 - 2022
      • Exhibit 20: Historic Market Size – Component Segment 2018 - 2022 ($ billion)
    • 4.4 Geography Segment Analysis 2018 - 2022
      • Exhibit 21: Historic Market Size – Geography Segment 2018 - 2022 ($ billion)
    • 4.5 Country Segment Analysis 2018 - 2022
      • Exhibit 22: Historic Market Size – Country Segment 2018 - 2022 ($ billion)

    5 Five Forces Analysis

    • 5.1 Five forces summary
      • Exhibit 23: Five forces analysis - Comparison between 2023 and 2028
    • 5.2 Bargaining power of buyers
      • Exhibit 24: Chart on Bargaining power of buyers – Impact of key factors 2023 and 2028
    • 5.3 Bargaining power of suppliers
      • Exhibit 25: Bargaining power of suppliers – Impact of key factors in 2023 and 2028
    • 5.4 Threat of new entrants
      • Exhibit 26: Threat of new entrants – Impact of key factors in 2023 and 2028
    • 5.5 Threat of substitutes
      • Exhibit 27: Threat of substitutes – Impact of key factors in 2023 and 2028
    • 5.6 Threat of rivalry
      • Exhibit 28: Threat of rivalry – Impact of key factors in 2023 and 2028
    • 5.7 Market condition
      • Exhibit 29: Chart on Market condition - Five forces 2023 and 2028

    6 Market Segmentation by End-user

    • 6.1 Market segments
      • Exhibit 30: Chart on End-user - Market share 2023-2028 (%)
      • Exhibit 31: Data Table on End-user - Market share 2023-2028 (%)
    • 6.2 Comparison by End-user
      • Exhibit 32: Chart on Comparison by End-user
      • Exhibit 33: Data Table on Comparison by End-user
    • 6.3 Building automation - Market size and forecast 2023-2028
      • Exhibit 34: Chart on Building automation - Market size and forecast 2023-2028 ($ billion)
      • Exhibit 35: Data Table on Building automation - Market size and forecast 2023-2028 ($ billion)
      • Exhibit 36: Chart on Building automation - Year-over-year growth 2023-2028 (%)
      • Exhibit 37: Data Table on Building automation - Year-over-year growth 2023-2028 (%)
    • 6.4 Wearable devices - Market size and forecast 2023-2028
      • Exhibit 38: Chart on Wearable devices - Market size and forecast 2023-2028 ($ billion)
      • Exhibit 39: Data Table on Wearable devices - Market size and forecast 2023-2028 ($ billion)
      • Exhibit 40: Chart on Wearable devices - Year-over-year growth 2023-2028 (%)
      • Exhibit 41: Data Table on Wearable devices - Year-over-year growth 2023-2028 (%)
    • 6.5 Healthcare - Market size and forecast 2023-2028
      • Exhibit 42: Chart on Healthcare - Market size and forecast 2023-2028 ($ billion)
      • Exhibit 43: Data Table on Healthcare - Market size and forecast 2023-2028 ($ billion)
      • Exhibit 44: Chart on Healthcare - Year-over-year growth 2023-2028 (%)
      • Exhibit 45: Data Table on Healthcare - Year-over-year growth 2023-2028 (%)
    • 6.6 Automotive and transportation - Market size and forecast 2023-2028
      • Exhibit 46: Chart on Automotive and transportation - Market size and forecast 2023-2028 ($ billion)
      • Exhibit 47: Data Table on Automotive and transportation - Market size and forecast 2023-2028 ($ billion)
      • Exhibit 48: Chart on Automotive and transportation - Year-over-year growth 2023-2028 (%)
      • Exhibit 49: Data Table on Automotive and transportation - Year-over-year growth 2023-2028 (%)
    • 6.7 Others - Market size and forecast 2023-2028
      • Exhibit 50: Chart on Others - Market size and forecast 2023-2028 ($ billion)
      • Exhibit 51: Data Table on Others - Market size and forecast 2023-2028 ($ billion)
      • Exhibit 52: Chart on Others - Year-over-year growth 2023-2028 (%)
      • Exhibit 53: Data Table on Others - Year-over-year growth 2023-2028 (%)
    • 6.8 Market opportunity by End-user
      • Exhibit 54: Market opportunity by End-user ($ billion)
      • Exhibit 55: Data Table on Market opportunity by End-user ($ billion)

    7 Market Segmentation by Component

    • 7.1 Market segments
      • Exhibit 56: Chart on Component - Market share 2023-2028 (%)
      • Exhibit 57: Data Table on Component - Market share 2023-2028 (%)
    • 7.2 Comparison by Component
      • Exhibit 58: Chart on Comparison by Component
      • Exhibit 59: Data Table on Comparison by Component
    • 7.3 Hardware - Market size and forecast 2023-2028
      • Exhibit 60: Chart on Hardware - Market size and forecast 2023-2028 ($ billion)
      • Exhibit 61: Data Table on Hardware - Market size and forecast 2023-2028 ($ billion)
      • Exhibit 62: Chart on Hardware - Year-over-year growth 2023-2028 (%)
      • Exhibit 63: Data Table on Hardware - Year-over-year growth 2023-2028 (%)
    • 7.4 Software - Market size and forecast 2023-2028
      • Exhibit 64: Chart on Software - Market size and forecast 2023-2028 ($ billion)
      • Exhibit 65: Data Table on Software - Market size and forecast 2023-2028 ($ billion)
      • Exhibit 66: Chart on Software - Year-over-year growth 2023-2028 (%)
      • Exhibit 67: Data Table on Software - Year-over-year growth 2023-2028 (%)
    • 7.5 Services - Market size and forecast 2023-2028
      • Exhibit 68: Chart on Services - Market size and forecast 2023-2028 ($ billion)
      • Exhibit 69: Data Table on Services - Market size and forecast 2023-2028 ($ billion)
      • Exhibit 70: Chart on Services - Year-over-year growth 2023-2028 (%)
      • Exhibit 71: Data Table on Services - Year-over-year growth 2023-2028 (%)
    • 7.6 Market opportunity by Component
      • Exhibit 72: Market opportunity by Component ($ billion)
      • Exhibit 73: Data Table on Market opportunity by Component ($ billion)

    8 Customer Landscape

    • 8.1 Customer landscape overview
      • Exhibit 74: Analysis of price sensitivity, lifecycle, customer purchase basket, adoption rates, and purchase criteria

    9 Geographic Landscape

    • 9.1 Geographic segmentation
      • Exhibit 75: Chart on Market share by geography 2023-2028 (%)
      • Exhibit 76: Data Table on Market share by geography 2023-2028 (%)
    • 9.2 Geographic comparison
      • Exhibit 77: Chart on Geographic comparison
      • Exhibit 78: Data Table on Geographic comparison
    • 9.3 North America - Market size and forecast 2023-2028
      • Exhibit 79: Chart on North America - Market size and forecast 2023-2028 ($ billion)
      • Exhibit 80: Data Table on North America - Market size and forecast 2023-2028 ($ billion)
      • Exhibit 81: Chart on North America - Year-over-year growth 2023-2028 (%)
      • Exhibit 82: Data Table on North America - Year-over-year growth 2023-2028 (%)
    • 9.4 APAC - Market size and forecast 2023-2028
      • Exhibit 83: Chart on APAC - Market size and forecast 2023-2028 ($ billion)
      • Exhibit 84: Data Table on APAC - Market size and forecast 2023-2028 ($ billion)
      • Exhibit 85: Chart on APAC - Year-over-year growth 2023-2028 (%)
      • Exhibit 86: Data Table on APAC - Year-over-year growth 2023-2028 (%)
    • 9.5 Europe - Market size and forecast 2023-2028
      • Exhibit 87: Chart on Europe - Market size and forecast 2023-2028 ($ billion)
      • Exhibit 88: Data Table on Europe - Market size and forecast 2023-2028 ($ billion)
      • Exhibit 89: Chart on Europe - Year-over-year growth 2023-2028 (%)
      • Exhibit 90: Data Table on Europe - Year-over-year growth 2023-2028 (%)
    • 9.6 South America - Market size and forecast 2023-2028
      • Exhibit 91: Chart on South America - Market size and forecast 2023-2028 ($ billion)
      • Exhibit 92: Data Table on South America - Market size and forecast 2023-2028 ($ billion)
      • Exhibit 93: Chart on South America - Year-over-year growth 2023-2028 (%)
      • Exhibit 94: Data Table on South America - Year-over-year growth 2023-2028 (%)
    • 9.7 Middle East and Africa - Market size and forecast 2023-2028
      • Exhibit 95: Chart on Middle East and Africa - Market size and forecast 2023-2028 ($ billion)
      • Exhibit 96: Data Table on Middle East and Africa - Market size and forecast 2023-2028 ($ billion)
      • Exhibit 97: Chart on Middle East and Africa - Year-over-year growth 2023-2028 (%)
      • Exhibit 98: Data Table on Middle East and Africa - Year-over-year growth 2023-2028 (%)
    • 9.8 US - Market size and forecast 2023-2028
      • Exhibit 99: Chart on US - Market size and forecast 2023-2028 ($ billion)
      • Exhibit 100: Data Table on US - Market size and forecast 2023-2028 ($ billion)
      • Exhibit 101: Chart on US - Year-over-year growth 2023-2028 (%)
      • Exhibit 102: Data Table on US - Year-over-year growth 2023-2028 (%)
    • 9.9 China - Market size and forecast 2023-2028
      • Exhibit 103: Chart on China - Market size and forecast 2023-2028 ($ billion)
      • Exhibit 104: Data Table on China - Market size and forecast 2023-2028 ($ billion)
      • Exhibit 105: Chart on China - Year-over-year growth 2023-2028 (%)
      • Exhibit 106: Data Table on China - Year-over-year growth 2023-2028 (%)
    • 9.10 Germany - Market size and forecast 2023-2028
      • Exhibit 107: Chart on Germany - Market size and forecast 2023-2028 ($ billion)
      • Exhibit 108: Data Table on Germany - Market size and forecast 2023-2028 ($ billion)
      • Exhibit 109: Chart on Germany - Year-over-year growth 2023-2028 (%)
      • Exhibit 110: Data Table on Germany - Year-over-year growth 2023-2028 (%)
    • 9.11 UK - Market size and forecast 2023-2028
      • Exhibit 111: Chart on UK - Market size and forecast 2023-2028 ($ billion)
      • Exhibit 112: Data Table on UK - Market size and forecast 2023-2028 ($ billion)
      • Exhibit 113: Chart on UK - Year-over-year growth 2023-2028 (%)
      • Exhibit 114: Data Table on UK - Year-over-year growth 2023-2028 (%)
    • 9.12 Japan - Market size and forecast 2023-2028
      • Exhibit 115: Chart on Japan - Market size and forecast 2023-2028 ($ billion)
      • Exhibit 116: Data Table on Japan - Market size and forecast 2023-2028 ($ billion)
      • Exhibit 117: Chart on Japan - Year-over-year growth 2023-2028 (%)
      • Exhibit 118: Data Table on Japan - Year-over-year growth 2023-2028 (%)
    • 9.13 Market opportunity by geography
      • Exhibit 119: Market opportunity by geography ($ billion)
      • Exhibit 120: Data Tables on Market opportunity by geography ($ billion)

    10 Drivers, Challenges, and Trends

    • 10.1 Market drivers
      • 10.2 Market challenges
        • 10.3 Impact of drivers and challenges
          • Exhibit 121: Impact of drivers and challenges in 2023 and 2028
        • 10.4 Market trends

          11 Vendor Landscape

          • 11.1 Overview
            • 11.2 Vendor landscape
              • Exhibit 122: Overview on Criticality of inputs and Factors of differentiation
            • 11.3 Landscape disruption
              • Exhibit 123: Overview on factors of disruption
            • 11.4 Industry risks
              • Exhibit 124: Impact of key risks on business

            12 Vendor Analysis

            • 12.1 Vendors covered
              • Exhibit 125: Vendors covered
            • 12.2 Market positioning of vendors
              • Exhibit 126: Matrix on vendor position and classification
            • 12.3 ABB Ltd.
              • Exhibit 127: ABB Ltd. - Overview
              • Exhibit 128: ABB Ltd. - Business segments
              • Exhibit 129: ABB Ltd. - Key news
              • Exhibit 130: ABB Ltd. - Key offerings
              • Exhibit 131: ABB Ltd. - Segment focus
            • 12.4 Analog Devices Inc.
              • Exhibit 132: Analog Devices Inc. - Overview
              • Exhibit 133: Analog Devices Inc. - Business segments
              • Exhibit 134: Analog Devices Inc. - Key news
              • Exhibit 135: Analog Devices Inc. - Key offerings
              • Exhibit 136: Analog Devices Inc. - Segment focus
            • 12.5 Emerson Electric Co.
              • Exhibit 137: Emerson Electric Co. - Overview
              • Exhibit 138: Emerson Electric Co. - Business segments
              • Exhibit 139: Emerson Electric Co. - Key news
              • Exhibit 140: Emerson Electric Co. - Key offerings
              • Exhibit 141: Emerson Electric Co. - Segment focus
            • 12.6 General Electric Co.
              • Exhibit 142: General Electric Co. - Overview
              • Exhibit 143: General Electric Co. - Business segments
              • Exhibit 144: General Electric Co. - Key news
              • Exhibit 145: General Electric Co. - Key offerings
              • Exhibit 146: General Electric Co. - Segment focus
            • 12.7 Honeywell International Inc.
              • Exhibit 147: Honeywell International Inc. - Overview
              • Exhibit 148: Honeywell International Inc. - Business segments
              • Exhibit 149: Honeywell International Inc. - Key news
              • Exhibit 150: Honeywell International Inc. - Key offerings
              • Exhibit 151: Honeywell International Inc. - Segment focus
            • 12.8 Laird Connectivity
              • Exhibit 152: Laird Connectivity - Overview
              • Exhibit 153: Laird Connectivity - Product / Service
              • Exhibit 154: Laird Connectivity - Key offerings
            • 12.9 NXP Semiconductors NV
              • Exhibit 155: NXP Semiconductors NV - Overview
              • Exhibit 156: NXP Semiconductors NV - Product / Service
              • Exhibit 157: NXP Semiconductors NV - Key news
              • Exhibit 158: NXP Semiconductors NV - Key offerings
            • 12.10 Robert Bosch GmbH
              • Exhibit 159: Robert Bosch GmbH - Overview
              • Exhibit 160: Robert Bosch GmbH - Business segments
              • Exhibit 161: Robert Bosch GmbH - Key offerings
              • Exhibit 162: Robert Bosch GmbH - Segment focus
            • 12.11 Schneider Electric SE
              • Exhibit 163: Schneider Electric SE - Overview
              • Exhibit 164: Schneider Electric SE - Business segments
              • Exhibit 165: Schneider Electric SE - Key offerings
              • Exhibit 166: Schneider Electric SE - Segment focus
            • 12.12 Sensata Technologies Inc.
              • Exhibit 167: Sensata Technologies Inc. - Overview
              • Exhibit 168: Sensata Technologies Inc. - Business segments
              • Exhibit 169: Sensata Technologies Inc. - Key news
              • Exhibit 170: Sensata Technologies Inc. - Key offerings
              • Exhibit 171: Sensata Technologies Inc. - Segment focus
            • 12.13 Siemens AG
              • Exhibit 172: Siemens AG - Overview
              • Exhibit 173: Siemens AG - Business segments
              • Exhibit 174: Siemens AG - Key news
              • Exhibit 175: Siemens AG - Key offerings
              • Exhibit 176: Siemens AG - Segment focus
            • 12.14 STMicroelectronics International NV
              • Exhibit 177: STMicroelectronics International NV - Overview
              • Exhibit 178: STMicroelectronics International NV - Business segments
              • Exhibit 179: STMicroelectronics International NV - Key news
              • Exhibit 180: STMicroelectronics International NV - Key offerings
              • Exhibit 181: STMicroelectronics International NV - Segment focus
            • 12.15 TE Connectivity Ltd.
              • Exhibit 182: TE Connectivity Ltd. - Overview
              • Exhibit 183: TE Connectivity Ltd. - Business segments
              • Exhibit 184: TE Connectivity Ltd. - Key news
              • Exhibit 185: TE Connectivity Ltd. - Key offerings
              • Exhibit 186: TE Connectivity Ltd. - Segment focus
            • 12.16 Texas Instruments Inc.
              • Exhibit 187: Texas Instruments Inc. - Overview
              • Exhibit 188: Texas Instruments Inc. - Business segments
              • Exhibit 189: Texas Instruments Inc. - Key news
              • Exhibit 190: Texas Instruments Inc. - Key offerings
              • Exhibit 191: Texas Instruments Inc. - Segment focus
            • 12.17 Yokogawa Electric Corp.
              • Exhibit 192: Yokogawa Electric Corp. - Overview
              • Exhibit 193: Yokogawa Electric Corp. - Business segments
              • Exhibit 194: Yokogawa Electric Corp. - Key offerings
              • Exhibit 195: Yokogawa Electric Corp. - Segment focus

            13 Appendix

            • 13.1 Scope of the report
              • 13.2 Inclusions and exclusions checklist
                • Exhibit 196: Inclusions checklist
                • Exhibit 197: Exclusions checklist
              • 13.3 Currency conversion rates for US$
                • Exhibit 198: Currency conversion rates for US$
              • 13.4 Research methodology
                • Exhibit 199: Research methodology
                • Exhibit 200: Validation techniques employed for market sizing
                • Exhibit 201: Information sources
              • 13.5 List of abbreviations
                • Exhibit 202: List of abbreviations

              Research Methodology

              Technavio presents a detailed picture of the market by way of study, synthesis, and summation of data from multiple sources. The analysts have presented the various facets of the market with a particular focus on identifying the key industry influencers. The data thus presented is comprehensive, reliable, and the result of extensive research, both primary and secondary.

              INFORMATION SOURCES

              Primary sources

              • Manufacturers and suppliers
              • Channel partners
              • Industry experts
              • Strategic decision makers

              Secondary sources

              • Industry journals and periodicals
              • Government data
              • Financial reports of key industry players
              • Historical data
              • Press releases

              DATA ANALYSIS

              Data Synthesis

              • Collation of data
              • Estimation of key figures
              • Analysis of derived insights

              Data Validation

              • Triangulation with data models
              • Reference against proprietary databases
              • Corroboration with industry experts

              REPORT WRITING

              Qualitative

              • Market drivers
              • Market challenges
              • Market trends
              • Five forces analysis

              Quantitative

              • Market size and forecast
              • Market segmentation
              • Geographical insights
              • Competitive landscape

              Interested in this report?

              Get your sample now to see our research methodology and insights!

              Download Now

              Frequently Asked Questions

              Wireless Sensors market growth will increase by $ 28.87 bn during 2024-2028.

              The Wireless Sensors market is expected to grow at a CAGR of 18.02% during 2024-2028.

              Wireless Sensors market is segmented by End-user( Building automation, Wearable devices, Healthcare, Automotive and transportation, Others) Component( Hardware, Software, Services)

              ABB Ltd., ADT Inc., Advantech Co. Ltd., Analog Devices Inc., Emerson Electric Co., General Electric Co., Honeywell International Inc., Infineon Technologies AG, Koninklijke Philips N.V., Laird Connectivity, Legrand SA, Libelium Comunicaciones Distribuidas SL, Lutron Electronics Co. Inc., Microchip Technology Inc., NXP Semiconductors NV, Renesas Electronics Corp., Robert Bosch GmbH, Schneider Electric SE, Sensata Technologies Inc., Siemens AG, Somfy SA, STMicroelectronics International NV, TE Connectivity Ltd., Texas Instruments Inc., Yokogawa Electric Corp., Broadcom Inc. are a few of the key vendors in the Wireless Sensors market.

              North America will register the highest growth rate of 30% among the other regions. Therefore, the Wireless Sensors market in North America is expected to garner significant business opportunities for the vendors during the forecast period.

              US, China, Japan, Germany, UK

              • Increasing adoption of Industry 4.0The implementation of Industry 4.0 is the driving factor this market.
              • which involves the integration of digital technologies into manufacturing processes is the driving factor this market.
              • is a significant revenue driver for the global wireless sensors market. Industry 4.0 aims to create smart factories in which machines is the driving factor this market.
              • systems is the driving factor this market.
              • and processes communicate and collaborate in real-time is the driving factor this market.
              • resulting in increased efficiency is the driving factor this market.
              • productivity is the driving factor this market.
              • and data-driven decision-making. Wireless sensors play an important role in this transformation is the driving factor this market.
              • providing the connectivity and real-time data required for smart manufacturing. Wireless sensors are used throughout the manufacturing process of wireless sensors to monitor and collect data on parameters such as temperature is the driving factor this market.
              • humidity is the driving factor this market.
              • pressure is the driving factor this market.
              • and equipment status. These sensors enable predictive maintenance is the driving factor this market.
              • optimize energy usage is the driving factor this market.
              • increase overall equipment efficiency (OEE) is the driving factor this market.
              • and allow for quick response to changes in production conditions. Major vendors in the global wireless sensors market capitalize on the industry 4.0 trend: Siemens AG: Siemens provides a variety of wireless sensor solutions for industrial automation is the driving factor this market.
              • such as condition monitoring is the driving factor this market.
              • asset tracking is the driving factor this market.
              • and energy management. These solutions are in line with Industry 4.0 principles and aim to improve operational efficiency. ABB Ltd. offers wireless sensor solutions for predictive maintenance and condition monitoring. These sensors help manufacturers transition to Industry 4.0 practices by ensuring the dependability and performance of critical machinery. Bosch Connected Devices and Solutions GmbH (Robert Bosch GmbH): Bosch provides wireless sensor devices for industrial applications is the driving factor this market.
              • which contribute to the implementation of Industry 4.0. These sensors help with predictive maintenance is the driving factor this market.
              • process efficiency is the driving factor this market.
              • and connectivity in smart manufacturing environments. As Industry 4.0 adoption grows globally is the driving factor this market.
              • the demand for wireless sensors is expected to rise is the driving factor this market.
              • driven by the need for real-time data is the driving factor this market.
              • automation is the driving factor this market.
              • and connectivity in modern manufacturing environments. The aforementioned vendors demonstrate the integration of wireless sensor technologies into Industry 4.0 solutions is the driving factor this market.
              • establishing themselves as key players in the evolving landscape of smart manufacturing. Thus is the driving factor this market.
              • the increasing relevance of Industry 4.0 in many end-user industries is the driving factor this market.
              • like the manufacturing industry is the driving factor this market.
              • is anticipated to fuel the growth of the global wireless sensors market during the forecast period. is the driving factor this market.

              The Wireless Sensors market vendors should focus on grabbing business opportunities from the Building automation segment as it accounted for the largest market share in the base year.