Wooden Casks Market Size 2024-2028
The wooden casks market size is forecast to increase by USD 1.82 billion at a CAGR of 7.13% between 2023 and 2028.
What will be the Size of the Wooden Casks Market During the Forecast Period?
How is this Wooden Casks Industry segmented and which is the largest segment?
The wooden casks industry research report provides comprehensive data (region-wise segment analysis), with forecasts and estimates in "USD million" for the period 2024-2028, as well as historical data from 2018-2022 for the following segments.
- End-user
- Offline
- Online
- Geography
- Europe
- France
- Italy
- Spain
- North America
- US
- APAC
- South America
- Argentina
- Middle East and Africa
- Europe
By End-user Insights
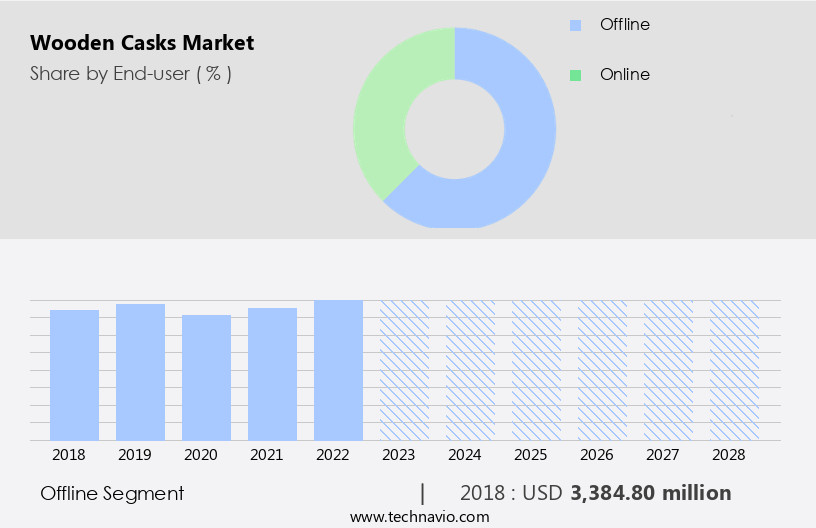
The offline segment is estimated to witness significant growth during the forecast period. Wineries, distilleries, breweries, and food producers rely on cooperages for high-quality wooden casks to store and age their products. Offline sales enable detailed discussions on specifications, ensuring casks meet buyers' specific needs. Buyers can physically inspect casks for quality, craftsmanship, and defects, crucial for maintaining product integrity. Customization options, such as specific toasting levels or wood types, are available through offline distribution. Auctions offer access to rare, vintage, or high-quality second-hand casks, expanding sourcing possibilities. Quality materials like cedar barrels provide a light moisture and smell barrier, while heat sealing temperatures ensure food hygiene and environmental protection. Ellagitannin, a natural antioxidant in oak, enhances the aging process of alcoholic beverages like craft beers, craft breweries' aged oak-flavored liquor, and distilleries' scotch whisky and bourbon aged barrels.
The use of oak wood, sourced from oak trees, is essential for the winemaking process, aging wines, and producing premium, high-end products. However, challenges include health and safety regulations, storage space, oak supply, labor costs, and transportation expenses. Proper oak wood management and international trade considerations are crucial to mitigate these pitfalls.
Get a glance at the market report of various segments Request Free Sample
The Offline segment was valued at USD 3.38 billion in 2018 and showed a gradual increase during the forecast period.
Regional Analysis
Europe is estimated to contribute 37% to the growth of the global market during the forecast period. Technavio’s analysts have elaborately explained the regional trends and drivers that shape the market during the forecast period.
For more insights on the market size of various regions, Request Free Sample
The European wooden cask market caters to the aging process of wines, whiskies, and other spirits, particularly in countries like Scotland, France, and Spain, known for their aged beverages. The increasing preference for premium and luxury beverages fuels the demand for high-quality wooden casks. Cask-aged products, such as craft beers, craft breweries, aged oak-flavored liquor from distilleries and wineries, Tobasco hot sauce, and Scotch whisky, are gaining popularity among consumers. Brands like Ellagitannin, Schoeller Allibert, Exotic Barrels, Mystic Barrels, Red Head Barrels, and others offer various packaging options to meet this demand. The market is subject to health, safety regulations, storage space, oak supply, labor costs, and transportation expenses.
Key players In the market include Ecobulk MX 560, Vantage Market Research, and Juniper Research. The use of oak wood, sourced from oak trees, is essential for the aging process. However, factors like international trade disruptions, lockdowns, and transportation challenges may impact the market. Despite these pitfalls, the market continues to grow, driven by the demand for aged spirits from craft distilleries and wineries.
Market Dynamics
Our researchers analyzed the data with 2023 as the base year, along with the key drivers, trends, and challenges. A holistic analysis of drivers will help companies refine their marketing strategies to gain a competitive advantage.
What are the key market drivers leading to the rise In the adoption of Wooden Casks Industry?
- Growing demand for aged beverages is the key driver of the market.The market is experiencing growth due to the rising production and consumption of aged beverages, such as whiskey, wine, rum, brandy, and other spirits. Consumers value the complex flavors and craftsmanship involved in aging processes, leading to a willingness to pay a premium for high-quality, aged beverages. This trend is driven by cultural and social factors emphasizing authenticity and heritage. For example, McDowell's & Co. Launched their Distiller's Batch Indian Single Malt Whisky in May 2024, showcasing the art and tradition of aging beverages. Wooden casks, primarily made of oak, play a crucial role in this process.
They provide a light moisture and smell barrier, while heat sealing temperatures ensure food hygiene and environmental protection. Ellagitannin, a natural antioxidant found in oak, contributes to the aging process and enhances the flavor profile of the beverages. The market for wooden casks caters to various industries, including alcoholic beverages, petroleum, and chemicals. Craft breweries and distilleries, wineries, and tobaccolandscaping> tobacco sauce manufacturers are significant consumers. Packaging options range from traditional cedar barrels to modern, heat-sealed containers from companies like Ecobulk MX 560, Schoeller Allibert, Exotic Barrels, and Mystic Barrels. Despite the growth opportunities, the market faces challenges, including health and safety regulations, storage space, oak supply, labor costs, and transportation expenses.
The increasing popularity of premium and high-end products, such as aged spirits, craft beverages, and micro-distilleries, is expected to continue driving demand for wooden casks.
What are the market trends shaping the Wooden Casks market?
- Growing focus on sustainable wooden casks is the upcoming market trend.The market is witnessing significant growth due to the increasing demand for high-quality materials In the production of chemicals, petroleum, alcoholic beverages, and other industries. Wooden casks, primarily made of oak wood, provide a light moisture and smell barrier, ensuring optimal preservation of contents. FMI research indicates that cedar barrels, used In the aging process of alcoholic beverages such as craft beers and aged oak-flavored liquor, contribute to the market's expansion. Producers, including distilleries and wineries, are focusing on food hygiene and environmental protection, leading to the adoption of sustainable practices. Speyside Cooperage KY, for instance, sources oak exclusively from sustainably managed forests and minimizes waste and optimizes logistics, ensuring a responsible supply of raw materials.
Heat sealing temperatures are crucial in maintaining the integrity of the casks, and the use of advanced technology enables consistent and efficient production. The market caters to various packaging options, including those for Scotch whisky, bourbon aged barrels, and other aged spirits. The market faces challenges such as health and safety regulations, storage space, oak supply, labor costs, and transportation expenses. Despite these pitfalls, the demand for premium and high-end products continues to drive the market, with micro-distilleries and breweries increasingly adopting barrel-aged practices In the craft beverages sector. The winemaking process and the aging of wines further contribute to the market's growth, with consumers seeking authentic, aged products.
Cooperages employ traditional methods alongside modern techniques to create high-quality, long-lasting casks. The use of exotic barrels, such as those from Ellagitannin, Schoeller Allibert, Exotic Barrels, Mystic Barrels, and Red Head Barrels, adds value to the market. Transaction value In the market is expected to increase as consumers and producers continue to prioritize quality and sustainability. The market also caters to niche applications, such as In the production of Tobasco hot sauce and Tobasco pepper, demonstrating its versatility.
What challenges does the Wooden Casks Industry face during its growth?
- Long lead times of wooden casks is a key challenge affecting the industry growth.The market encompasses the production and usage of wooden barrels for aging and storing various beverages, including alcoholic ones like whiskey, wine, and rum, as well as chemicals and petroleum. FMI research reveals that these casks are primarily made of high-quality materials, such as cedar barrels, which provide a light moisture and smell barrier, and heat sealing temperatures that ensure food hygiene and environmental protection. However, the production and aging processes of wooden casks come with long lead times, ranging from several months to several years. This necessitates meticulous planning and forecasting by producers to ensure a consistent supply of aged products that meet market demand.
The upfront costs of investing in wooden casks can be substantial, potentially impacting cash flow and financial planning. Moreover, predicting future demand accurately can be challenging due to fluctuating consumer preferences and economic conditions. The market dynamics also include factors like oak supply, labor costs, transportation expenses, and health and safety regulations. Producers of aged spirits, such as scotch whisky, bourbon aged barrels, and craft distilleries, often use oak wood from oak trees to impart a distinct flavor to their products. Packaging options for wooden casks include those from brands like Ecobulk MX 560, Schoeller Allibert, Exotic Barrels, Mystic Barrels, Red Head Barrels, and others.
These barrels are used for aging wine, scotch, whiskey, and other premium and high-end products. The winemaking process also involves aging wines in oak barrels, while micro-distilleries and breweries utilize barrel-aged techniques for craft beers and craft beverages. In conclusion, the market is driven by the need for quality materials to age and store various beverages and chemicals, but the long lead times and upfront costs can pose challenges for producers. Producers must carefully plan and forecast demand to ensure a consistent supply of aged products, while also navigating factors like oak supply, labor costs, transportation expenses, and health and safety regulations.
Exclusive Customer Landscape
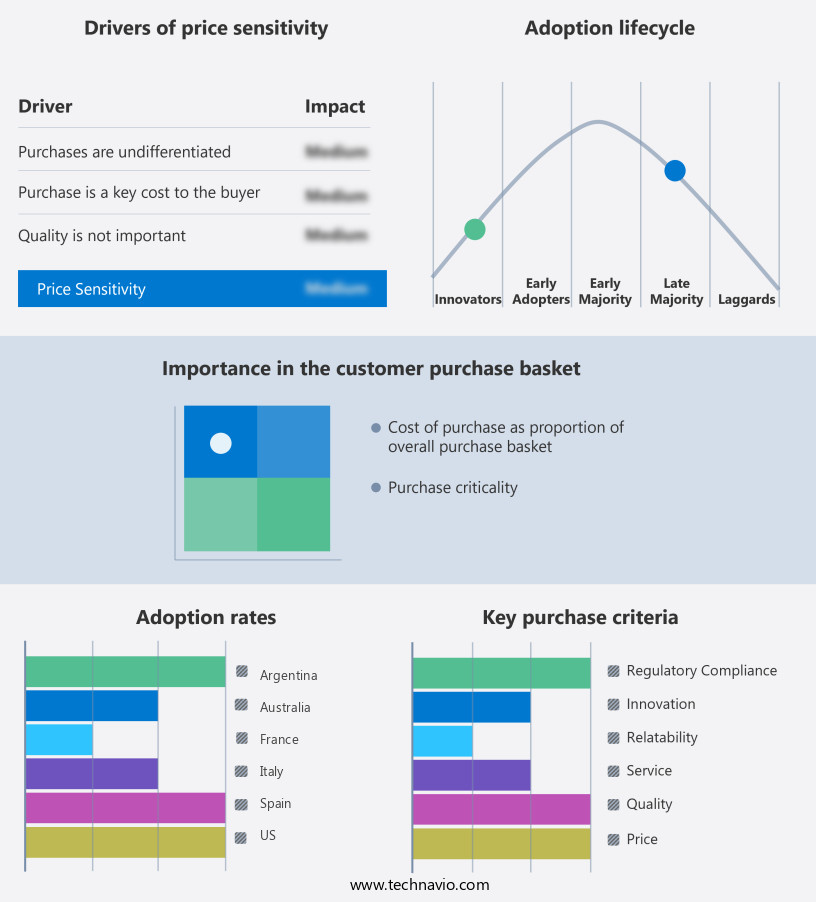
The wooden casks market forecasting report includes the adoption lifecycle of the market, covering from the innovator’s stage to the laggard’s stage. It focuses on adoption rates in different regions based on penetration. Furthermore, the wooden casks market report also includes key purchase criteria and drivers of price sensitivity to help companies evaluate and develop their market growth analysis strategies.
Customer Landscape
Key Companies & Market Insights
Companies are implementing various strategies, such as strategic alliances, wooden casks market forecast, partnerships, mergers and acquisitions, geographical expansion, and product/service launches, to enhance their presence In the industry.
Barrel Builders Inc. - The company specializes in providing a range of high-quality wooden casks for various applications. Among their offerings are Emanation Granulats, Emanation Chips, and Emanation Cubes. These wooden casks are known for their durability and ability to preserve and enhance the flavor of their contents. The granulats provide a large surface area for contact with the product, while the chips offer a balanced combination of size and surface area. The cubes offer a uniform shape and size, making them ideal for specific processes. With a focus on excellence and innovation, the company ensures that each cask meets the highest standards of quality and performance.
The industry research and growth report includes detailed analyses of the competitive landscape of the market and information about key companies, including:
- Barrel Builders Inc.
- Canton Cooperage
- Cask World
- Charlois Group
- Classic Oak Products
- G and P Garbellotto SpA
- Groupe Vicard
- Hubert Co.
- Independent Stave Co. LLC
- Nadalie USA
- NORTHEAST BARREL CO.
- Oak barrels
- Premier Wine Cask
- RADOUX INC
- Saury
- SEGUIN MOREAU NAPA COOPERAGE
- Speyside Cooperage KY
- T.W. Boswell
- The Barrel Mill
- The Oak Cooperage
Qualitative and quantitative analysis of companies has been conducted to help clients understand the wider business environment as well as the strengths and weaknesses of key industry players. Data is qualitatively analyzed to categorize companies as pure play, category-focused, industry-focused, and diversified; it is quantitatively analyzed to categorize companies as dominant, leading, strong, tentative, and weak.
Research Analyst Overview
The market encompasses a diverse range of applications across various industries, primarily In the production and aging of chemicals, petroleum, alcoholic beverages, and food products. These containers, crafted from high-quality material such as oak, play a crucial role in enhancing the final product's flavor, aroma, and overall quality. Casks serve multiple functions, acting as a lightweight and breathable container that allows for optimal moisture control and a reliable smell barrier. Heat sealing temperatures are crucial to ensure proper sealing and prevent contamination. The importance of food hygiene and environmental protection is paramount, making the use of wooden casks a popular choice for those industries.
Ellagitannins, naturally occurring compounds found in oak, contribute significantly to the aging process of various products. In the alcoholic beverages sector, oak-flavored liquor, craft beers, and aged spirits from craft distilleries and wineries all benefit from the use of wooden casks. The winemaking process and the aging of wines, scotch whisky, bourbon aged barrels, and other spirits are all reliant on the unique properties of oak. The market for wooden casks is not limited to traditional applications. Tobasco hot sauce and other food products also utilize these containers to preserve and enhance their flavors. Packaging options for these products can vary, from cedar barrels to exotic barrels and even customized solutions from Schoeller Allibert and other cooperages.
Despite the numerous benefits, the market faces several challenges. Health and safety regulations, storage space requirements, and the cost of oak supply, labor, and transportation all impact the market dynamics. The availability of oak wood, sourced from oak trees, can be affected by factors such as international trade restrictions, lockdowns, and transportation issues. The rise of craft beverages and high-end products has led to an increased demand for new barrels and other oak barrels. However, this trend also presents pitfalls, as the high-value nature of these products necessitates careful handling and storage to maintaIn their quality. In conclusion, the market plays a vital role in various industries, from chemicals and petroleum to alcoholic beverages and food products.
The unique properties of oak and the aging process it facilitates make wooden casks an indispensable component In the production and preservation of these products. However, the market is not without its challenges, requiring continuous innovation and adaptation to meet the evolving needs of industries and consumers.
|
Market Scope |
|
|
Report Coverage |
Details |
|
Page number |
190 |
|
Base year |
2023 |
|
Historic period |
2018-2022 |
|
Forecast period |
2024-2028 |
|
Growth momentum & CAGR |
Accelerate at a CAGR of 7.13% |
|
Market growth 2024-2028 |
USD 1816.6 million |
|
Market structure |
Fragmented |
|
YoY growth 2023-2024(%) |
6.32 |
|
Key countries |
France, US, Italy, Spain, Argentina, and Australia |
|
Competitive landscape |
Leading Companies, Market Positioning of Companies, Competitive Strategies, and Industry Risks |
What are the Key Data Covered in this Wooden Casks Market Research and Growth Report?
- CAGR of the Wooden Casks industry during the forecast period
- Detailed information on factors that will drive the growth and forecasting between 2024 and 2028
- Precise estimation of the size of the market and its contribution of the industry in focus to the parent market
- Accurate predictions about upcoming growth and trends and changes in consumer behaviour
- Growth of the market across Europe, North America, APAC, South America, and Middle East and Africa
- Thorough analysis of the market’s competitive landscape and detailed information about companies
- Comprehensive analysis of factors that will challenge the wooden casks market growth of industry companies
We can help! Our analysts can customize this wooden casks market research report to meet your requirements.


