Workwear Market Analysis APAC, Europe, North America, Middle East and Africa, South America - China, US, Japan, Germany, India, Canada, South Korea, UK, France, Italy - Size and Forecast 2025-2029

Workwear Market Analysis APAC, Europe, North America, Middle East and Africa, South America - China, US, Japan, Germany, India, Canada, South Korea, UK, France, Italy - Size and Forecast 2025-2029

Published: Feb 2025 222 Pages SKU: IRTNTR76069

Market Overview at a Glance

$5.96 B
Market Opportunity
5.4%
CAGR
5.1
YoY growth 2024-2025(%)

Workwear Market Size 2025-2029

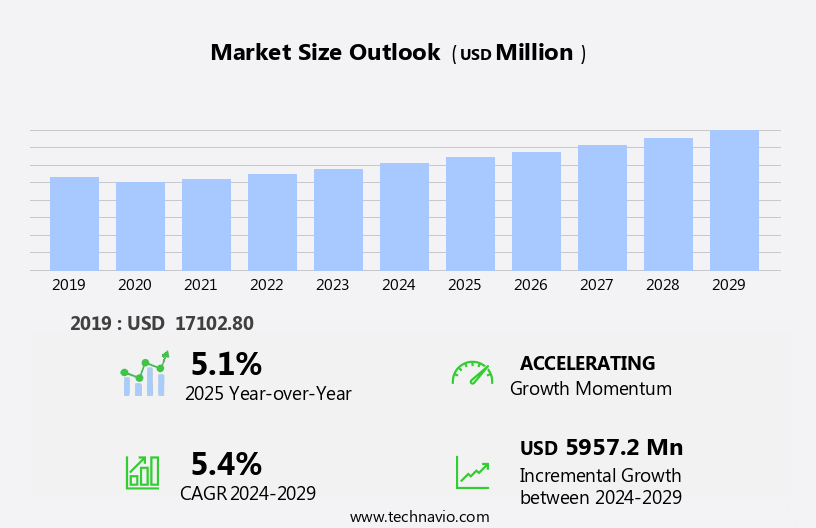
The workwear market size is forecast to increase by USD 5.96 billion, at a CAGR of 5.4% between 2024 and 2029.

  • The market is driven by the strict implementation of workplace safety standards in developed countries, prioritizing employee well-being and regulatory compliance. In contrast, emerging economies face challenges with the poor implementation of workplace safety norms, creating a significant disparity in market dynamics. This dichotomy necessitates a strategic approach for companies seeking to capitalize on opportunities and navigate challenges. An increasing focus on emergency management in the wake of natural disasters and industrial accidents further underscores the importance of workwear in ensuring employee safety.
  • However, the inconsistent application of safety regulations in developing countries poses a significant challenge. Companies must navigate this complex landscape by implementing robust corporate social responsibility initiatives and collaborating with local governments to promote adherence to safety standards. By doing so, they can not only mitigate risks but also contribute to the development of a safer and more responsible workwear industry.

What will be the Size of the Workwear Market during the forecast period?

Workwear Market Size

Explore in-depth regional segment analysis with market size data - historical 2019-2023 and forecasts 2025-2029 - in the full report.  
Request Free Sample

The market continues to evolve, with dynamic trends shaping its various sectors. Workwear fashion embraces innovation, with designs incorporating functionality and comfort. Fabrics, such as moisture-wicking and flame-resistant, cater to diverse industries and climate conditions. Safety regulations play a crucial role, driving the demand for protective work wear gear, including safety helmets and gloves. Workwear wash cycles are optimized for durability and cost-effectiveness, while weatherproof workwear ensures employee safety and productivity. Industrial apparel manufacturers integrate smart workwear technology, enabling data analytics and performance tracking. Certifications and compliance standards ensure safety and quality, while workwear distributors and retailers streamline supply chain operations.

Sustainability is a growing concern, with eco-friendly workwear materials and manufacturing processes gaining popularity. Workwear customization, from branding to size and design, caters to unique business needs. Safety footwear, workwear accessories, and high-visibility clothing further expand the market's scope. Workwear maintenance and repair services ensure longevity and cost savings. Workwear value is a continuous focus, balancing performance, cost, and sustainability. Market activities unfold, with ongoing collaborations, mergers, and acquisitions shaping the competitive landscape. Workwear trends reflect the industry's commitment to employee safety, comfort, and productivity.

How is this Workwear Industry segmented?

The workwear industry research report provides comprehensive data (region-wise segment analysis), with forecasts and estimates in "USD million" for the period 2025-2029, as well as historical data from 2019-2023 for the following segments.

  • End-user
    • Men
    • Women
  • Product
    • Apparel
    • Footwear
  • Distribution Channel
    • Offline
    • Online
  • Application
    • Construction
    • Oil and gas
    • Chemicals
    • Healthcare
    • Others
  • Geography
    • North America
      • US
      • Canada
    • Europe
      • France
      • Germany
      • Italy
      • UK
    • APAC
      • China
      • India
      • Japan
      • South Korea
    • Rest of World (ROW)

By End-user Insights

The men segment is estimated to witness significant growth during the forecast period.

Men comprise a significant portion of the market, driven by the reliance of various industries such as manufacturing, oil and gas, transportation, and construction on male labor. These sectors prioritize workwear that ensures safety and durability to protect their workers from hazards. The product range for men's workwear includes high-visibility clothing, safety helmets, work trousers, uniforms, and protective coveralls. The expanding workforce and increasing awareness of workplace safety regulations further fuel the demand for workwear that meets these requirements. Manufacturers focus on delivering innovative, comfortable, and functional workwear solutions to cater to this market. Workwear fabrics, such as flame-resistant and moisture-wicking, are essential considerations for industries with hazardous conditions.

Workwear technology, including data analytics and smart workwear, enhances performance and safety. Workwear supply chains prioritize compliance with industry standards and certifications to ensure quality and safety. Workwear cost is a crucial factor, with wholesalers and retailers offering various pricing strategies to cater to different market segments. Anti-static workwear and protective gear, such as gloves and safety footwear, are essential components of the market. Workwear maintenance and innovation are ongoing priorities, with manufacturers investing in sustainable materials and advanced technologies to improve workwear durability and value. Trends in workwear fashion and design continue to evolve, with an increasing focus on comfort, functionality, and branding.

Workwear wash cycles and weatherproof capabilities are essential features for industries with demanding work environments. In conclusion, The market is dynamic and diverse, driven by the need for safety, durability, and functionality in various industries. Manufacturers, distributors, and retailers are continuously innovating to meet the evolving demands of the market, ensuring workers remain protected and productive.

Workwear Market Size

Request Free Sample

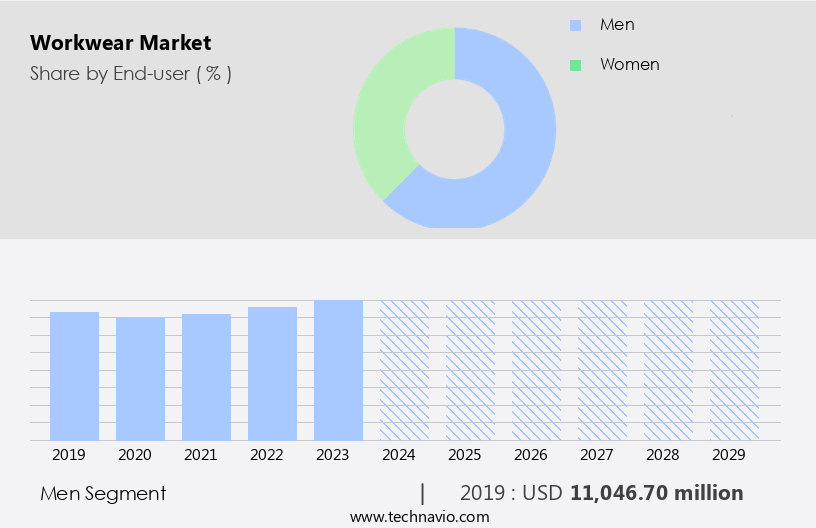
The Men segment was valued at USD 11.05 billion in 2019 and showed a gradual increase during the forecast period.

Regional Analysis

APAC is estimated to contribute 46% to the growth of the global market during the forecast period.Technavio's analysts have elaborately explained the regional trends and drivers that shape the market during the forecast period.

Workwear Market Share by Geography

 Request Free Sample

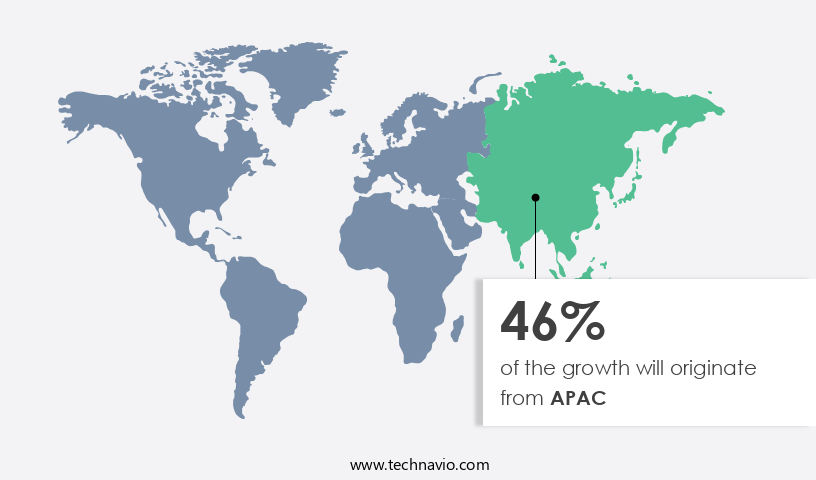
In The market, APAC is a significant player due to its large industrial workforce. Despite having a lower penetration rate compared to North America and Europe, developing countries in APAC, such as India, are prioritizing workplace safety norms. This shift has led to market growth in the region, surpassing other geographies. Strict supervision and increased compliance with occupational health and safety laws have contributed to this improvement. The workwear industry in APAC is witnessing advancements in various areas. For instance, the transportation sector's growing investments and expanding warehousing capacity have enhanced the supply chain infrastructure.

Additionally, the production and availability of processed food and personal care products have increased significantly in the region. Workwear fabrics, sizing, and compliance with safety regulations are essential considerations for manufacturers. Flame-resistant and moisture-wicking fabrics are popular choices due to their protective qualities. Workwear trousers, uniforms, and safety helmets are common items in the market. Innovations in workwear technology include connected workwear, high-visibility clothing, and smart workwear. Workwear trends include customization, sustainability, and workwear fashion. Certifications and compliance with various standards, such as OSHA and ISO, are crucial for manufacturers and distributors. Workwear maintenance and durability are essential factors for both employers and employees.

Workwear accessories, gloves, and jackets are essential components of the industry. Protective coveralls and safety footwear are crucial for industries with hazardous environments. Workwear wash cycles and weatherproof workwear are essential considerations for workwear retailers and wholesalers. Workwear value, performance, and functionality are critical factors for workwear buyers. Compliance with safety regulations and workwear certifications are essential for manufacturers and distributors. Workwear brands are investing in technology and design to meet the evolving needs of industries and workers. The market is diverse and dynamic, with various trends and innovations shaping its future. Workwear manufacturers and distributors must stay informed about the latest developments to remain competitive.

Workwear data analytics and performance metrics are increasingly important for optimizing workwear supply chains and enhancing worker safety.

Market Dynamics

Our researchers analyzed the data with 2024 as the base year, along with the key drivers, trends, and challenges. A holistic analysis of drivers will help companies refine their marketing strategies to gain a competitive advantage.

What are the key market drivers leading to the rise in the adoption of Workwear Industry?

  • In developed countries, the stringent enforcement of workplace safety standards serves as the primary catalyst for the market's growth. 
  • The demand for workwear in developed countries, including the US, is on the rise due to a growing focus on workplace safety and the strict enforcement of regulations. Organizations are investing in high-visibility clothing, protective gear, and workwear performance to ensure the safety of their employees from thermal, chemical, and biological hazards. Workwear data analytics is also gaining popularity, allowing companies to monitor the maintenance and usage of their workwear to optimize performance and extend the life of their investment. Connected workwear, which integrates technology into protective coveralls and other garments, is another emerging trend in the workwear industry. Workwear manufacturers are innovating to meet the evolving needs of industries, creating harmonious and immersive designs that prioritize both safety and comfort.
  • The Occupational Safety and Health Administration (OSHA) in the US has established regulations for personal protection equipment (PPE), including workwear, under 29 CFR 1910. These regulations mandate the use of certified workwear to ensure workplace safety. Workwear distributors play a crucial role in providing certified workwear and offering maintenance services to help organizations comply with regulations and maintain their workwear inventory.

What are the market trends shaping the Workwear Industry?

  • Emergency management is gaining significant attention in the current market, with a growing focus on preparedness and response strategies. It is essential for organizations and individuals to prioritize emergency planning to mitigate potential risks and ensure business continuity.
  • The demand for workwear is on the rise due to the increasing focus on workplace safety and the need for durable, weatherproof apparel for various industries. Workwear fashion continues to evolve, with an emphasis on smart workwear that adheres to safety regulations. Flame-resistant fabrics and workwear accessories, such as gloves, are essential components of industrial apparel. The value of workwear is not only in its functionality but also in its ability to withstand demanding wash cycles. Weatherproof workwear is particularly important for industries exposed to harsh weather conditions. Workwear design is becoming increasingly innovative, with a focus on comfort, functionality, and style.
  • Safety regulations play a significant role in the market, with stringent requirements for flame resistance, chemical resistance, and other protective features. Smart workwear is also gaining popularity, with the integration of technology to enhance functionality and safety. In conclusion, the market is driven by the need for durable, functional, and safe apparel in various industries. The increasing focus on workplace safety, coupled with the evolving demands of different industries, is expected to continue fueling the growth of the market. The importance of workwear extends beyond functionality, with an emphasis on comfort, style, and innovation.

What challenges does the Workwear Industry face during its growth?

  • The lack of effective implementation of workplace safety standards in developing countries poses a significant challenge to the expansion and growth of the industry. 
  • Workwear is essential protective clothing designed for professionals in various industries. Functionality and comfort are key considerations in workwear, with customization and moisture-wicking fabrics becoming increasingly popular. Brands prioritize safety features, including safety footwear, in their offerings. Workwear wholesalers and retailers cater to diverse industries, ensuring hygiene and workwear jackets that meet specific requirements. In developing countries, workplace safety regulations and their implementation remain a concern. Unlike established agencies like the Occupational Safety and Health Administration (OSHA) in the US and the Health and Safety Executive (HSE) in the UK, some countries have multiple regulatory bodies with unclear roles.
  • For instance, Kenya has three agencies overseeing health and safety in the oil and gas sector: the Energy and Petroleum Regulatory Authority (EPRA), the Directorate of Occupational Safety and Health Services (DOSHS), and the National Environment Management Authority (NEMA). Ensuring stringent enforcement of regulations and clear roles for regulatory bodies is crucial to promote a safe and productive work environment. Sustainability is also a growing concern, with an increasing focus on eco-friendly and ethically-produced workwear.

Exclusive Customer Landscape

The workwear market forecasting report includes the adoption lifecycle of the market, covering from the innovator's stage to the laggard's stage. It focuses on adoption rates in different regions based on penetration. Furthermore, the workwear market report also includes key purchase criteria and drivers of price sensitivity to help companies evaluate and develop their market growth analysis strategies.
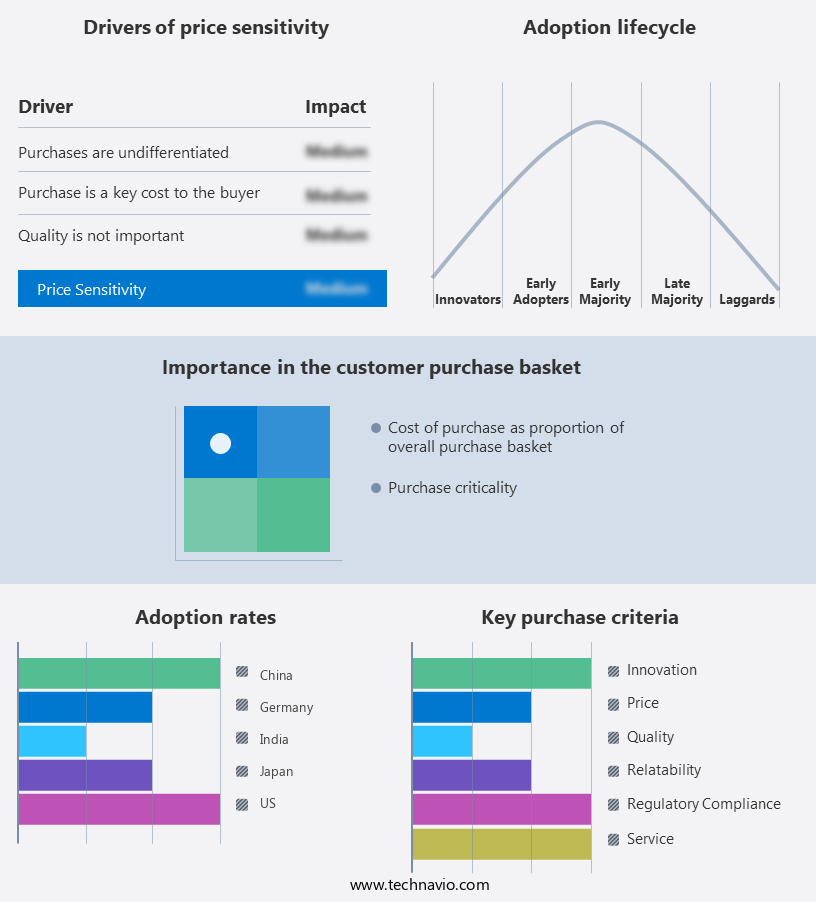
Workwear Market Share by Geography

 Customer Landscape

Key Companies & Market Insights

Companies are implementing various strategies, such as strategic alliances, workwear market forecast, partnerships, mergers and acquisitions, geographical expansion, and product/service launches, to enhance their presence in the industry.

3M Co. - The company specializes in providing top-tier workwear solutions, featuring 3M's disposable chemical protective coveralls. Our inventory encompasses two options: the 3M 4565 BLK L, designed for regular-sized individuals, and the 3M 4565 XXL, catering to larger workers. These coveralls prioritize safety, offering effective protection against chemicals. By incorporating these high-quality workwear items into your operations, you can enhance your team's safety standards and maintain a professional image.

The industry research and growth report includes detailed analyses of the competitive landscape of the market and information about key companies, including:

  • 3M Co.
  • A. LAFONT SAS
  • Aditya Birla Management Corp. Pvt. Ltd.
  • Ansell Ltd.
  • Ben F. Davis Co.
  • Berne Apparel
  • Carhartt Inc.
  • Delta Plus Group
  • H T Hughes and Co. Ltd.
  • Harveys of Oldham Holdings Ltd.
  • HejMar AB
  • Honeywell International Inc.
  • Hultafors Group AB
  • J and A International Ltd.
  • Lakeland Industries Inc.
  • Portwest Clothing Ltd.
  • Sioen Industries NV
  • VF Corp.
  • W. L. Gore and Associates Inc.
  • Wearwell Ltd.

Qualitative and quantitative analysis of companies has been conducted to help clients understand the wider business environment as well as the strengths and weaknesses of key industry players. Data is qualitatively analyzed to categorize companies as pure play, category-focused, industry-focused, and diversified; it is quantitatively analyzed to categorize companies as dominant, leading, strong, tentative, and weak.

Recent Development and News in Workwear Market

  • In March 2024, Carhartt, a leading workwear brand, introduced its new line of flame-resistant coveralls, designed to meet the increasing demand for safety clothing in the construction industry (Carhartt Press Release). This expansion underscores the market's focus on safety and compliance.
  • In July 2024, W.L. Gore & Associates, a materials science company, announced a strategic partnership with 3M to develop advanced workwear using Gore's GORE-TEX technology and 3M's Scotchlite reflective technology. This collaboration aims to create high-performance workwear with enhanced protection and visibility (Gore Press Release).
  • In October 2025, VF Corporation, a global apparel company, completed the acquisition of Dickies, a prominent workwear brand. This acquisition strengthened VF's position in the market and expanded its product offerings (VF Corporation SEC Filing).
  • In December 2025, the European Union passed the new Personal Protective Equipment Regulation (EU) 2025/1234, which sets new standards for workwear safety and testing. This regulation is expected to drive innovation and investment in the European the market (European Parliament Press Release).

Research Analyst Overview

  • In the dynamic the market, hand protection and respiratory protection remain essential categories for ensuring employee safety. Workwear labels prioritize arc rating, tear resistance, and abrasion resistance to meet industry standards. Wind resistance and moisture management are key features in workwear fabrics, enhancing comfort and productivity. Bio-based workwear and recycled materials are gaining traction, driving workwear sustainability. Safety glasses, hearing protection, and body protection are crucial components of a comprehensive safety strategy. Workwear innovation includes advanced foot protection with anti-slip properties, reflective materials for enhanced visibility, and workwear printing for customization. Eye protection and head protection complete the range of essential protective gear.
  • Workwear stitching and embroidery ensure durability, while water repellency and arc rating offer additional layers of protection.

Dive into Technavio's robust research methodology, blending expert interviews, extensive data synthesis, and validated models for unparalleled Workwear Market insights. See full methodology.

Market Scope

Report Coverage

Details

Page number

222

Base year

2024

Historic period

2019-2023

Forecast period

2025-2029

Growth momentum & CAGR

Accelerate at a CAGR of 5.4%

Market growth 2025-2029

USD 5957.2 million

Market structure

Fragmented

YoY growth 2024-2025(%)

5.1

Key countries

China, US, Japan, Germany, India, Canada, South Korea, UK, France, and Italy

Competitive landscape

Leading Companies, Market Positioning of Companies, Competitive Strategies, and Industry Risks

Request Free Sample

What are the Key Data Covered in this Workwear Market Research and Growth Report?

  • CAGR of the Workwear industry during the forecast period
  • Detailed information on factors that will drive the growth and forecasting between 2025 and 2029
  • Precise estimation of the size of the market and its contribution of the industry in focus to the parent market
  • Accurate predictions about upcoming growth and trends and changes in consumer behaviour
  • Growth of the market across APAC, Europe, North America, Middle East and Africa, and South America
  • Thorough analysis of the market's competitive landscape and detailed information about companies
  • Comprehensive analysis of factors that will challenge the workwear market growth of industry companies

We can help! Our analysts can customize this workwear market research report to meet your requirements.

Get in touch

1 Executive Summary

  • 1.1 Market overview
    • Executive Summary - Chart on Market Overview
    • Executive Summary - Data Table on Market Overview
    • Executive Summary - Chart on Global Market Characteristics
    • Executive Summary - Chart on Market by Geography
    • Executive Summary - Chart on Market Segmentation by End-user
    • Executive Summary - Chart on Market Segmentation by Product
    • Executive Summary - Chart on Market Segmentation by Distribution Channel
    • Executive Summary - Chart on Market Segmentation by Application
    • Executive Summary - Chart on Incremental Growth
    • Executive Summary - Data Table on Incremental Growth
    • Executive Summary - Chart on Company Market Positioning

2 Technavio Analysis

  • 2.1 Analysis of price sensitivity, lifecycle, customer purchase basket, adoption rates, and purchase criteria
    • Analysis of price sensitivity, lifecycle, customer purchase basket, adoption rates, and purchase criteria
  • 2.2 Criticality of inputs and Factors of differentiation
    • Overview on criticality of inputs and factors of differentiation
  • 2.3 Factors of disruption
    • Overview on factors of disruption
  • 2.4 Impact of drivers and challenges
    • Impact of drivers and challenges in 2024 and 2029

3 Market Landscape

  • 3.1 Market ecosystem
    • Parent Market
    • Data Table on - Parent Market
  • 3.2 Market characteristics
    • Market characteristics analysis
  • 3.3 Value chain analysis
    • Value chain analysis

4 Market Sizing

  • 4.1 Market definition
    • Offerings of companies included in the market definition
  • 4.2 Market segment analysis
    • Market segments
  • 4.3 Market size 2024
    • 4.4 Market outlook: Forecast for 2024-2029
      • Chart on Global - Market size and forecast 2024-2029 ($ million)
      • Data Table on Global - Market size and forecast 2024-2029 ($ million)
      • Chart on Global Market: Year-over-year growth 2024-2029 (%)
      • Data Table on Global Market: Year-over-year growth 2024-2029 (%)

    5 Historic Market Size

    • 5.1 Global Workwear Market 2019 - 2023
      • Historic Market Size - Data Table on Global Workwear Market 2019 - 2023 ($ million)
    • 5.2 End-user segment analysis 2019 - 2023
      • Historic Market Size - End-user Segment 2019 - 2023 ($ million)
    • 5.3 Product segment analysis 2019 - 2023
      • Historic Market Size - Product Segment 2019 - 2023 ($ million)
    • 5.4 Distribution Channel segment analysis 2019 - 2023
      • Historic Market Size - Distribution Channel Segment 2019 - 2023 ($ million)
    • 5.5 Application segment analysis 2019 - 2023
      • Historic Market Size - Application Segment 2019 - 2023 ($ million)
    • 5.6 Geography segment analysis 2019 - 2023
      • Historic Market Size - Geography Segment 2019 - 2023 ($ million)
    • 5.7 Country segment analysis 2019 - 2023
      • Historic Market Size - Country Segment 2019 - 2023 ($ million)

    6 Qualitative Analysis

    • 6.1 The AI impact on global workwear market

      7 Five Forces Analysis

      • 7.1 Five forces summary
        • Five forces analysis - Comparison between 2024 and 2029
      • 7.2 Bargaining power of buyers
        • Bargaining power of buyers - Impact of key factors 2024 and 2029
      • 7.3 Bargaining power of suppliers
        • Bargaining power of suppliers - Impact of key factors in 2024 and 2029
      • 7.4 Threat of new entrants
        • Threat of new entrants - Impact of key factors in 2024 and 2029
      • 7.5 Threat of substitutes
        • Threat of substitutes - Impact of key factors in 2024 and 2029
      • 7.6 Threat of rivalry
        • Threat of rivalry - Impact of key factors in 2024 and 2029
      • 7.7 Market condition
        • Chart on Market condition - Five forces 2024 and 2029

      8 Market Segmentation by End-user

      • 8.1 Market segments
        • Chart on End-user - Market share 2024-2029 (%)
        • Data Table on End-user - Market share 2024-2029 (%)
      • 8.2 Comparison by End-user
        • Chart on Comparison by End-user
        • Data Table on Comparison by End-user
      • 8.3 Men - Market size and forecast 2024-2029
        • Chart on Men - Market size and forecast 2024-2029 ($ million)
        • Data Table on Men - Market size and forecast 2024-2029 ($ million)
        • Chart on Men - Year-over-year growth 2024-2029 (%)
        • Data Table on Men - Year-over-year growth 2024-2029 (%)
      • 8.4 Women - Market size and forecast 2024-2029
        • Chart on Women - Market size and forecast 2024-2029 ($ million)
        • Data Table on Women - Market size and forecast 2024-2029 ($ million)
        • Chart on Women - Year-over-year growth 2024-2029 (%)
        • Data Table on Women - Year-over-year growth 2024-2029 (%)
      • 8.5 Market opportunity by End-user
        • Market opportunity by End-user ($ million)
        • Data Table on Market opportunity by End-user ($ million)

      9 Market Segmentation by Product

      • 9.1 Market segments
        • Chart on Product - Market share 2024-2029 (%)
        • Data Table on Product - Market share 2024-2029 (%)
      • 9.2 Comparison by Product
        • Chart on Comparison by Product
        • Data Table on Comparison by Product
      • 9.3 Apparel - Market size and forecast 2024-2029
        • Chart on Apparel - Market size and forecast 2024-2029 ($ million)
        • Data Table on Apparel - Market size and forecast 2024-2029 ($ million)
        • Chart on Apparel - Year-over-year growth 2024-2029 (%)
        • Data Table on Apparel - Year-over-year growth 2024-2029 (%)
      • 9.4 Footwear - Market size and forecast 2024-2029
        • Chart on Footwear - Market size and forecast 2024-2029 ($ million)
        • Data Table on Footwear - Market size and forecast 2024-2029 ($ million)
        • Chart on Footwear - Year-over-year growth 2024-2029 (%)
        • Data Table on Footwear - Year-over-year growth 2024-2029 (%)
      • 9.5 Market opportunity by Product
        • Market opportunity by Product ($ million)
        • Data Table on Market opportunity by Product ($ million)

      10 Market Segmentation by Distribution Channel

      • 10.1 Market segments
        • Chart on Distribution Channel - Market share 2024-2029 (%)
        • Data Table on Distribution Channel - Market share 2024-2029 (%)
      • 10.2 Comparison by Distribution Channel
        • Chart on Comparison by Distribution Channel
        • Data Table on Comparison by Distribution Channel
      • 10.3 Offline - Market size and forecast 2024-2029
        • Chart on Offline - Market size and forecast 2024-2029 ($ million)
        • Data Table on Offline - Market size and forecast 2024-2029 ($ million)
        • Chart on Offline - Year-over-year growth 2024-2029 (%)
        • Data Table on Offline - Year-over-year growth 2024-2029 (%)
      • 10.4 Online - Market size and forecast 2024-2029
        • Chart on Online - Market size and forecast 2024-2029 ($ million)
        • Data Table on Online - Market size and forecast 2024-2029 ($ million)
        • Chart on Online - Year-over-year growth 2024-2029 (%)
        • Data Table on Online - Year-over-year growth 2024-2029 (%)
      • 10.5 Market opportunity by Distribution Channel
        • Market opportunity by Distribution Channel ($ million)
        • Data Table on Market opportunity by Distribution Channel ($ million)

      11 Market Segmentation by Application

      • 11.1 Market segments
        • Chart on Application - Market share 2024-2029 (%)
        • Data Table on Application - Market share 2024-2029 (%)
      • 11.2 Comparison by Application
        • Chart on Comparison by Application
        • Data Table on Comparison by Application
      • 11.3 Construction - Market size and forecast 2024-2029
        • Chart on Construction - Market size and forecast 2024-2029 ($ million)
        • Data Table on Construction - Market size and forecast 2024-2029 ($ million)
        • Chart on Construction - Year-over-year growth 2024-2029 (%)
        • Data Table on Construction - Year-over-year growth 2024-2029 (%)
      • 11.4 Oil and gas - Market size and forecast 2024-2029
        • Chart on Oil and gas - Market size and forecast 2024-2029 ($ million)
        • Data Table on Oil and gas - Market size and forecast 2024-2029 ($ million)
        • Chart on Oil and gas - Year-over-year growth 2024-2029 (%)
        • Data Table on Oil and gas - Year-over-year growth 2024-2029 (%)
      • 11.5 Chemicals - Market size and forecast 2024-2029
        • Chart on Chemicals - Market size and forecast 2024-2029 ($ million)
        • Data Table on Chemicals - Market size and forecast 2024-2029 ($ million)
        • Chart on Chemicals - Year-over-year growth 2024-2029 (%)
        • Data Table on Chemicals - Year-over-year growth 2024-2029 (%)
      • 11.6 Healthcare - Market size and forecast 2024-2029
        • Chart on Healthcare - Market size and forecast 2024-2029 ($ million)
        • Data Table on Healthcare - Market size and forecast 2024-2029 ($ million)
        • Chart on Healthcare - Year-over-year growth 2024-2029 (%)
        • Data Table on Healthcare - Year-over-year growth 2024-2029 (%)
      • 11.7 Others - Market size and forecast 2024-2029
        • Chart on Others - Market size and forecast 2024-2029 ($ million)
        • Data Table on Others - Market size and forecast 2024-2029 ($ million)
        • Chart on Others - Year-over-year growth 2024-2029 (%)
        • Data Table on Others - Year-over-year growth 2024-2029 (%)
      • 11.8 Market opportunity by Application
        • Market opportunity by Application ($ million)
        • Data Table on Market opportunity by Application ($ million)

      12 Customer Landscape

      • 12.1 Customer landscape overview
        • Analysis of price sensitivity, lifecycle, customer purchase basket, adoption rates, and purchase criteria

      13 Geographic Landscape

      • 13.1 Geographic segmentation
        • Chart on Market share by geography 2024-2029 (%)
        • Data Table on Market share by geography 2024-2029 (%)
      • 13.2 Geographic comparison
        • Chart on Geographic comparison
        • Data Table on Geographic comparison
      • 13.3 APAC - Market size and forecast 2024-2029
        • Chart on APAC - Market size and forecast 2024-2029 ($ million)
        • Data Table on APAC - Market size and forecast 2024-2029 ($ million)
        • Chart on APAC - Year-over-year growth 2024-2029 (%)
        • Data Table on APAC - Year-over-year growth 2024-2029 (%)
      • 13.4 Europe - Market size and forecast 2024-2029
        • Chart on Europe - Market size and forecast 2024-2029 ($ million)
        • Data Table on Europe - Market size and forecast 2024-2029 ($ million)
        • Chart on Europe - Year-over-year growth 2024-2029 (%)
        • Data Table on Europe - Year-over-year growth 2024-2029 (%)
      • 13.5 North America - Market size and forecast 2024-2029
        • Chart on North America - Market size and forecast 2024-2029 ($ million)
        • Data Table on North America - Market size and forecast 2024-2029 ($ million)
        • Chart on North America - Year-over-year growth 2024-2029 (%)
        • Data Table on North America - Year-over-year growth 2024-2029 (%)
      • 13.6 Middle East and Africa - Market size and forecast 2024-2029
        • Chart on Middle East and Africa - Market size and forecast 2024-2029 ($ million)
        • Data Table on Middle East and Africa - Market size and forecast 2024-2029 ($ million)
        • Chart on Middle East and Africa - Year-over-year growth 2024-2029 (%)
        • Data Table on Middle East and Africa - Year-over-year growth 2024-2029 (%)
      • 13.7 South America - Market size and forecast 2024-2029
        • Chart on South America - Market size and forecast 2024-2029 ($ million)
        • Data Table on South America - Market size and forecast 2024-2029 ($ million)
        • Chart on South America - Year-over-year growth 2024-2029 (%)
        • Data Table on South America - Year-over-year growth 2024-2029 (%)
      • 13.8 China - Market size and forecast 2024-2029
        • Chart on China - Market size and forecast 2024-2029 ($ million)
        • Data Table on China - Market size and forecast 2024-2029 ($ million)
        • Chart on China - Year-over-year growth 2024-2029 (%)
        • Data Table on China - Year-over-year growth 2024-2029 (%)
      • 13.9 US - Market size and forecast 2024-2029
        • Chart on US - Market size and forecast 2024-2029 ($ million)
        • Data Table on US - Market size and forecast 2024-2029 ($ million)
        • Chart on US - Year-over-year growth 2024-2029 (%)
        • Data Table on US - Year-over-year growth 2024-2029 (%)
      • 13.10 Japan - Market size and forecast 2024-2029
        • Chart on Japan - Market size and forecast 2024-2029 ($ million)
        • Data Table on Japan - Market size and forecast 2024-2029 ($ million)
        • Chart on Japan - Year-over-year growth 2024-2029 (%)
        • Data Table on Japan - Year-over-year growth 2024-2029 (%)
      • 13.11 Germany - Market size and forecast 2024-2029
        • Chart on Germany - Market size and forecast 2024-2029 ($ million)
        • Data Table on Germany - Market size and forecast 2024-2029 ($ million)
        • Chart on Germany - Year-over-year growth 2024-2029 (%)
        • Data Table on Germany - Year-over-year growth 2024-2029 (%)
      • 13.12 India - Market size and forecast 2024-2029
        • Chart on India - Market size and forecast 2024-2029 ($ million)
        • Data Table on India - Market size and forecast 2024-2029 ($ million)
        • Chart on India - Year-over-year growth 2024-2029 (%)
        • Data Table on India - Year-over-year growth 2024-2029 (%)
      • 13.13 Canada - Market size and forecast 2024-2029
        • Chart on Canada - Market size and forecast 2024-2029 ($ million)
        • Data Table on Canada - Market size and forecast 2024-2029 ($ million)
        • Chart on Canada - Year-over-year growth 2024-2029 (%)
        • Data Table on Canada - Year-over-year growth 2024-2029 (%)
      • 13.14 South Korea - Market size and forecast 2024-2029
        • Chart on South Korea - Market size and forecast 2024-2029 ($ million)
        • Data Table on South Korea - Market size and forecast 2024-2029 ($ million)
        • Chart on South Korea - Year-over-year growth 2024-2029 (%)
        • Data Table on South Korea - Year-over-year growth 2024-2029 (%)
      • 13.15 UK - Market size and forecast 2024-2029
        • Chart on UK - Market size and forecast 2024-2029 ($ million)
        • Data Table on UK - Market size and forecast 2024-2029 ($ million)
        • Chart on UK - Year-over-year growth 2024-2029 (%)
        • Data Table on UK - Year-over-year growth 2024-2029 (%)
      • 13.16 France - Market size and forecast 2024-2029
        • Chart on France - Market size and forecast 2024-2029 ($ million)
        • Data Table on France - Market size and forecast 2024-2029 ($ million)
        • Chart on France - Year-over-year growth 2024-2029 (%)
        • Data Table on France - Year-over-year growth 2024-2029 (%)
      • 13.17 Italy - Market size and forecast 2024-2029
        • Chart on Italy - Market size and forecast 2024-2029 ($ million)
        • Data Table on Italy - Market size and forecast 2024-2029 ($ million)
        • Chart on Italy - Year-over-year growth 2024-2029 (%)
        • Data Table on Italy - Year-over-year growth 2024-2029 (%)
      • 13.18 Market opportunity by geography
        • Market opportunity by geography ($ million)
        • Data Tables on Market opportunity by geography ($ million)

      14 Drivers, Challenges, and Opportunity/Restraints

      • 14.1 Market drivers
        • 14.2 Market challenges
          • 14.3 Impact of drivers and challenges
            • Impact of drivers and challenges in 2024 and 2029
          • 14.4 Market opportunities/restraints

            15 Competitive Landscape

            • 15.1 Overview
              • 15.2 Competitive Landscape
                • Overview on criticality of inputs and factors of differentiation
              • 15.3 Landscape disruption
                • Overview on factors of disruption
              • 15.4 Industry risks
                • Impact of key risks on business

              16 Competitive Analysis

              • 16.1 Companies profiled
                • Companies covered
              • 16.2 Company ranking index
                • Company ranking index
              • 16.3 Market positioning of companies
                • Matrix on companies position and classification
              • 3M Co.
                • 3M Co. - Overview
                • 3M Co. - Business segments
                • 3M Co. - Key news
                • 3M Co. - Key offerings
                • 3M Co. - Segment focus
                • SWOT
              • 16.5 A. LAFONT SAS
                • A. LAFONT SAS - Overview
                • A. LAFONT SAS - Product / Service
                • A. LAFONT SAS - Key offerings
                • SWOT
              • 16.6 Aditya Birla Management Corp. Pvt. Ltd.
                • Aditya Birla Management Corp. Pvt. Ltd. - Overview
                • Aditya Birla Management Corp. Pvt. Ltd. - Product / Service
                • Aditya Birla Management Corp. Pvt. Ltd. - Key news
                • Aditya Birla Management Corp. Pvt. Ltd. - Key offerings
                • SWOT
              • 16.7 Ansell Ltd.
                • Ansell Ltd. - Overview
                • Ansell Ltd. - Business segments
                • Ansell Ltd. - Key news
                • Ansell Ltd. - Key offerings
                • Ansell Ltd. - Segment focus
                • SWOT
              • 16.8 Ben F. Davis Co.
                • Ben F. Davis Co. - Overview
                • Ben F. Davis Co. - Product / Service
                • Ben F. Davis Co. - Key offerings
                • SWOT
              • 16.9 Berne Apparel
                • Berne Apparel - Overview
                • Berne Apparel - Product / Service
                • Berne Apparel - Key offerings
                • SWOT
              • 16.10 Carhartt Inc.
                • Carhartt Inc. - Overview
                • Carhartt Inc. - Product / Service
                • Carhartt Inc. - Key offerings
                • SWOT
              • 16.11 Delta Plus Group
                • Delta Plus Group - Overview
                • Delta Plus Group - Business segments
                • Delta Plus Group - Key offerings
                • Delta Plus Group - Segment focus
                • SWOT
              • 16.12 HejMar AB
                • HejMar AB - Overview
                • HejMar AB - Product / Service
                • HejMar AB - Key offerings
                • SWOT
              • 16.13 Honeywell International Inc.
                • Honeywell International Inc. - Overview
                • Honeywell International Inc. - Business segments
                • Honeywell International Inc. - Key news
                • Honeywell International Inc. - Key offerings
                • Honeywell International Inc. - Segment focus
                • SWOT
              • 16.14 Hultafors Group AB
                • Hultafors Group AB - Overview
                • Hultafors Group AB - Product / Service
                • Hultafors Group AB - Key news
                • Hultafors Group AB - Key offerings
                • SWOT
              • 16.15 Lakeland Industries Inc.
                • Lakeland Industries Inc. - Overview
                • Lakeland Industries Inc. - Business segments
                • Lakeland Industries Inc. - Key news
                • Lakeland Industries Inc. - Key offerings
                • Lakeland Industries Inc. - Segment focus
                • SWOT
              • 16.16 Portwest Clothing Ltd.
                • Portwest Clothing Ltd. - Overview
                • Portwest Clothing Ltd. - Product / Service
                • Portwest Clothing Ltd. - Key offerings
                • SWOT
              • 16.17 VF Corp.
                • VF Corp. - Overview
                • VF Corp. - Business segments
                • VF Corp. - Key news
                • VF Corp. - Key offerings
                • VF Corp. - Segment focus
                • SWOT
              • 16.18 W. L. Gore and Associates Inc.
                • W. L. Gore and Associates Inc. - Overview
                • W. L. Gore and Associates Inc. - Product / Service
                • W. L. Gore and Associates Inc. - Key news
                • W. L. Gore and Associates Inc. - Key offerings
                • SWOT

              17 Appendix

              • 17.1 Scope of the report
                • 17.2 Inclusions and exclusions checklist
                  • Inclusions checklist
                  • Exclusions checklist
                • 17.3 Currency conversion rates for US$
                  • Currency conversion rates for US$
                • 17.4 Research methodology
                  • Research methodology
                • 17.5 Data procurement
                  • Information sources
                • 17.6 Data validation
                  • Data validation
                • 17.7 Validation techniques employed for market sizing
                  • Validation techniques employed for market sizing
                • 17.8 Data synthesis
                  • Data synthesis
                • 17.9 360 degree market analysis
                  • 360 degree market analysis
                • 17.10 List of abbreviations
                  • List of abbreviations

                Research Methodology

                Technavio presents a detailed picture of the market by way of study, synthesis, and summation of data from multiple sources. The analysts have presented the various facets of the market with a particular focus on identifying the key industry influencers. The data thus presented is comprehensive, reliable, and the result of extensive research, both primary and secondary.

                INFORMATION SOURCES

                Primary sources

                • Manufacturers and suppliers
                • Channel partners
                • Industry experts
                • Strategic decision makers

                Secondary sources

                • Industry journals and periodicals
                • Government data
                • Financial reports of key industry players
                • Historical data
                • Press releases

                DATA ANALYSIS

                Data Synthesis

                • Collation of data
                • Estimation of key figures
                • Analysis of derived insights

                Data Validation

                • Triangulation with data models
                • Reference against proprietary databases
                • Corroboration with industry experts

                REPORT WRITING

                Qualitative

                • Market drivers
                • Market challenges
                • Market trends
                • Five forces analysis

                Quantitative

                • Market size and forecast
                • Market segmentation
                • Geographical insights
                • Competitive landscape

                Interested in this report?

                Get your sample now to see our research methodology and insights!

                Download Now

                Frequently Asked Questions

                Workwear market growth will increase by $ 5957.2 mn during 2025-2029.

                The Workwear market is expected to grow at a CAGR of 5.4% during 2025-2029.

                Workwear market is segmented by End-user( Men, Women) Product( Apparel, Footwear) Distribution Channel( Offline, Online, Europe, South America, Middle East and Africa)

                3M Co., A. LAFONT SAS, Aditya Birla Management Corp. Pvt. Ltd., Ansell Ltd., Ben F. Davis Co., Berne Apparel, Carhartt Inc., Delta Plus Group, H T Hughes and Co. Ltd., Harveys of Oldham Holdings Ltd., HejMar AB, Honeywell International Inc., Hultafors Group AB, J and A International Ltd., Lakeland Industries Inc., Portwest Clothing Ltd., Sioen Industries NV, VF Corp., W. L. Gore and Associates Inc., Wearwell Ltd. are a few of the key vendors in the Workwear market.

                APAC will register the highest growth rate of 46% among the other regions. Therefore, the Workwear market in APAC is expected to garner significant business opportunities for the vendors during the forecast period.

                China, US, Japan, Germany, India, Canada, South Korea, UK, France, Italy

                • Strict implementation of workplace safety standards in developed countriesThe focus of industries on ensuring the safety of workers from thermal is the driving factor this market.
                • chemical is the driving factor this market.
                • and biological hazards and low visibility continues to grow. One of the reasons for this growing focus is improving workplace safety regulations and their strict enforcement is the driving factor this market.
                • especially in developed countries such as the US.Most developed countries have established regulations for workplace safety is the driving factor this market.
                • where enforcement agencies ensure strict compliance with such workplace safety regulations. Organizations also conduct training to improve workplace safety and create awareness of the effective use of safety gear. This enhances the demand for personal protection equipment is the driving factor this market.
                • including workwear is the driving factor this market.
                • in developed countries.For instance is the driving factor this market.
                • The Occupational Safety and Health Administration (OSHA) has laid down the requirements for personal protection equipment (PPE) in the Code of Federal Regulations (CFR) under 29 CFR 1910.132. Under this regulation is the driving factor this market.
                • OSHA mandates organizations to undertake a comprehensive hazard assessment. If employees are found vulnerable to possible injuries is the driving factor this market.
                • such risks must be eliminated through engineering is the driving factor this market.
                • work practice is the driving factor this market.
                • or administrative controls. If these risks cannot be eliminated is the driving factor this market.
                • workers must wear appropriate body protection during work.OSHA provides examples of safety hazards such as temperature extremes is the driving factor this market.
                • hot splashes from molten metals and other hot liquids is the driving factor this market.
                • and potential impacts from tools is the driving factor this market.
                • machinery is the driving factor this market.
                • and materials. These hazards require organizations to provide employees with suitable protective workwear during process operations.In 2024 is the driving factor this market.
                • OSHA finalized a revision to the PPE standard is the driving factor this market.
                • particularly for the construction industry is the driving factor this market.
                • emphasizing the proper fit of PPE. This revision aligns the construction industry standard with the general industry standard is the driving factor this market.
                • ensuring that PPE must properly fit any worker who needs it. Improperly sized PPE can be ineffective in protecting workers and may create new hazards is the driving factor this market.
                • such as oversized gloves or protective clothing being caught in machinery. This change addresses longstanding safety concerns is the driving factor this market.
                • particularly among women and physically smaller or larger workers.Regulatory bodies and enforcement agencies conduct scheduled and unscheduled inspections to assess workplace safety measures. Such inspections contribute to a reduction in workplace casualties is the driving factor this market.
                • occupational injuries is the driving factor this market.
                • and illness rates. For instance is the driving factor this market.
                • Workplace casualties in the US have fallen by nearly 65% since the passage of the OSH Act in 19701. OSHA routine workplace safety inspections have consistently helped reduce incidences of workplace safety violations is the driving factor this market.
                • indicating that organizations in the US are increasingly complying with workplace safety regulations is the driving factor this market.
                • including fall protection.OSHA has also raised the penalties for violations of workplace safety regulations by approximately 90% since 2015. These penalties were increased to ensure that the cost of violations remains significantly higher than the cost of compliance is the driving factor this market.
                • encouraging organizations to adhere to regulations is the driving factor this market.
                • particularly in terms of machine safeguarding. As of 2024 is the driving factor this market.
                • the maximum penalties for serious and other-serious violations are $16 is the driving factor this market.
                • 550 per violation is the driving factor this market.
                • and for willful or repeated violations is the driving factor this market.
                • the penalties are $165 is the driving factor this market.
                • 514 per violation. Thus is the driving factor this market.
                • strict enforcement of regulations and hefty penalties are driving demand for personal protection equipment is the driving factor this market.
                • including workwear is the driving factor this market.
                • in developed countries. This is expected to drive the growth of the global workwear market in focus during the forecast period. is the driving factor this market.

                The Workwear market vendors should focus on grabbing business opportunities from the Men segment as it accounted for the largest market share in the base year.