X-Ray Equipment Market Size 2025-2029
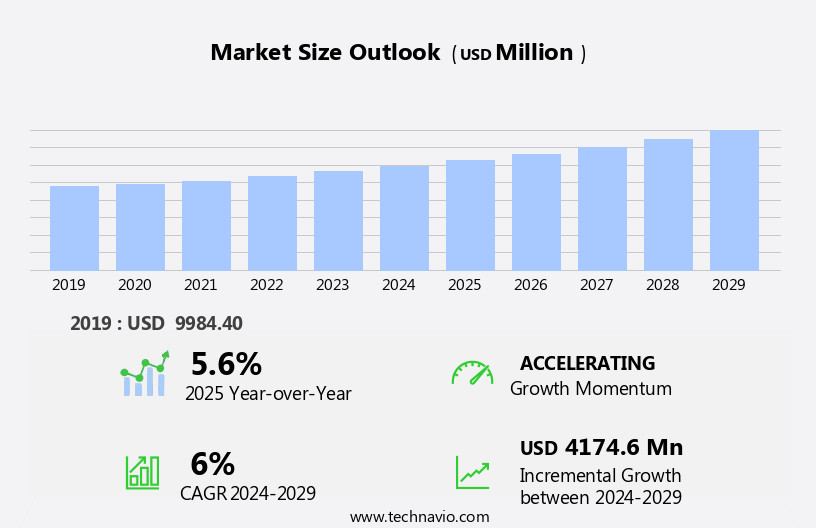
The X-ray equipment market size is forecast to increase by USD 4.17 billion at a CAGR of 6% between 2024 and 2029.
- The market is experiencing significant growth due to the increasing incidence of chronic diseases, leading to a higher demand for diagnostic imaging technologies. The global population is aging, resulting in a greater prevalence of diseases such as cancer, cardiovascular diseases, and respiratory disorders. This trend is driving the need for advanced X-Ray equipment to aid in early detection and diagnosis. Moreover, technological advances in X-Ray equipment are providing new opportunities for market growth. It indicates that innovations in digital X-Ray technology, such as high-resolution imaging and 3D imaging, are enhancing diagnostic accuracy and enabling faster diagnosis.
- However, the high cost of X-ray equipment remains a significant challenge for market growth. The initial investment required to purchase and install these systems can be prohibitive for many healthcare providers, particularly in low-income countries and small clinics. Additionally, the high cost of maintenance and replacement parts can make it difficult for organizations to keep their X-ray systems up-to-date and functioning optimally. To capitalize on market opportunities and navigate challenges effectively, companies in the market should focus on developing affordable and cost-effective solutions. Collaborations with governments and non-profit organizations to provide subsidized or grant-funded equipment to healthcare providers in developing countries could also help expand the market.
- Furthermore, offering flexible financing options and maintenance contracts could make X-ray equipment more accessible to smaller clinics and hospitals.
What will be the Size of the X-Ray Equipment Market during the forecast period?
- The market continues to evolve, driven by advancements in technology and applications across various sectors. Real-time imaging and big data analytics are revolutionizing diagnostic imaging, enabling personalized medicine and improved patient outcomes. Artificial intelligence and machine learning algorithms are enhancing image analysis, leading to more accurate diagnoses and efficient workflows. Image reconstruction and radiation therapy are benefiting from these technological advancements, ensuring regulatory compliance and enhancing patient safety. Digital radiography and portable X-ray systems are gaining popularity due to their convenience and cost-effectiveness. X-ray tubes and detectors, such as CCD and CMOS, are integral components, with ongoing research focusing on improving contrast resolution, spatial resolution, and image clarity. Computed tomography (CT) and digital radiography (DR) are transforming diagnostic imaging, offering high-definition imaging and 3D reconstruction. Interventional radiology and research facilities benefit from these technologies, enabling precise image registration and fusion.
- Mobile imaging and remote imaging solutions are expanding access to diagnostic services, particularly in underserved areas. Dental radiography and industrial x-ray applications are also advancing, with high-resolution imaging and contrast agents enabling more precise diagnoses and inspections. The integration of 3D imaging and computed tomography is further expanding the capabilities of X-ray equipment, opening up new clinical applications and research opportunities. Quality control and radiation shielding are critical considerations in the market, ensuring patient safety and regulatory compliance. Cloud computing and advanced imaging technologies are streamlining workflows and enabling more efficient data management and analysis. Big data analytics, machine learning (ML), and artificial intelligence (AI) are revolutionizing image interpretation and diagnosis, enabling faster and more accurate results.
- In summary, the market is a continuously evolving landscape, with ongoing advancements in technology and applications driving innovation and growth across various sectors. From personalized medicine to industrial inspections, X-ray equipment is a vital tool in improving healthcare outcomes and driving progress in research and development.
How is this X-Ray Equipment Industry segmented?
The x-ray equipment industry research report provides comprehensive data (region-wise segment analysis), with forecasts and estimates in "USD million" for the period 2025-2029, as well as historical data from 2019-2023 for the following segments.
- Technology
- Digital
- Analog
- End-user
- Hospitals
- Diagnostic imaging centers
- Application
- Radiology or general imaging
- Dental
- Orthopedics
- Cardiology
- Others
- Geography
- North America
- US
- Canada
- Europe
- France
- Germany
- Italy
- UK
- APAC
- China
- India
- Japan
- South America
- Brazil
- Rest of World (ROW)
- North America
By Technology Insights
The digital segment is estimated to witness significant growth during the forecast period. Digital X-ray equipment, a crucial component of diagnostic imaging, employs various digital detectors like charge-coupled devices and flat panel detectors, alongside an X-ray source, to generate diagnostic images by interacting with human tissues using digital electric sensors. This technology significantly reduces the cost per image due to its high processing speed, enabling radiologists to perform real-time visualization and capture images for clinical condition diagnosis. Portability is a key factor in digital X-ray equipment, with two primary types: fixed and portable. Fixed systems are installed in medical facilities, while portable X-ray machines offer greater convenience, allowing healthcare providers to bring imaging services to patients, especially beneficial for home care.
Advancements in technology have led to the integration of artificial intelligence (AI), machine learning, and big data analytics, enhancing image processing and analysis, and improving diagnostic accuracy. Real-time imaging, image enhancement, and 3D imaging are essential features that contribute to the growing demand for digital X-ray equipment. Regulatory compliance, patient safety, and image quality are critical factors in the industry. Regulations ensure the safety and effectiveness of X-ray equipment, while image quality is crucial for accurate diagnosis. Radiation shielding, contrast agents, and quality control measures are essential to minimize radiation exposure and maintain image accuracy. In the realm of research applications, digital X-ray equipment plays a significant role in medical imaging, non-destructive testing, and industrial X-ray. The market is further propelled by the integration of deep learning and AI in X-ray image recognition, enabling remote and automated diagnosis.
Furthermore, advancements in computed tomography, deep learning, and high-resolution imaging are pushing the boundaries of diagnostic capabilities. Cloud computing and mobile imaging facilitate remote imaging, making diagnostic services more accessible to patients, while maintaining data security and privacy. Precision medicine and personalized treatment plans rely on advanced imaging and diagnostic tools, further driving the demand for digital X-ray equipment. In summary, digital X-ray equipment is a vital diagnostic tool that continues to evolve with advancements in technology, offering benefits such as real-time imaging, portability, and enhanced image processing and analysis. Regulatory compliance, patient safety, and image quality remain essential considerations, while research applications and clinical uses expand the potential applications of this technology.
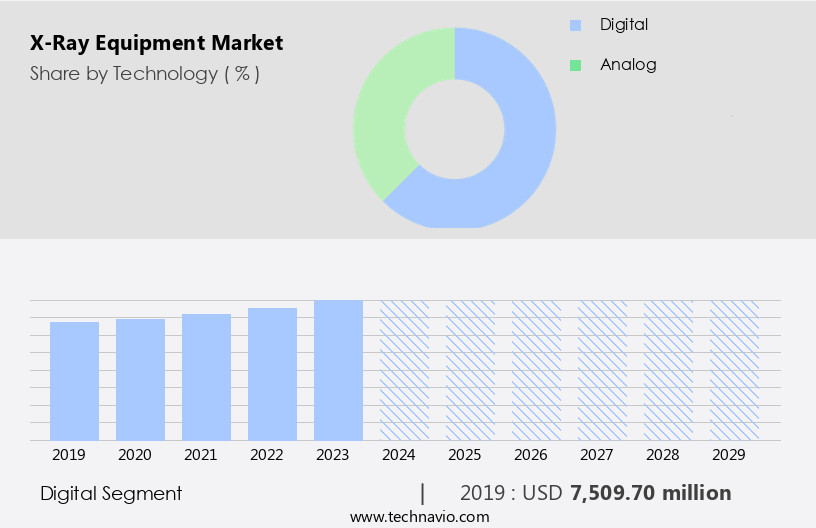
The Digital segment was valued at USD 7.51 billion in 2019 and showed a gradual increase during the forecast period.
Regional Analysis
North America is estimated to contribute 38% to the growth of the global market during the forecast period. Technavio's analysts have elaborately explained the regional trends and drivers that shape the market during the forecast period.
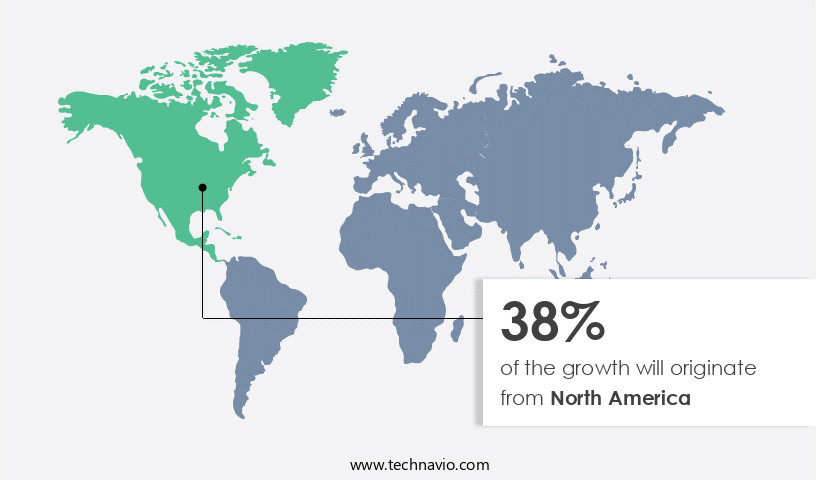
The market in North America is experiencing significant growth, with the US leading the charge. This expansion is driven by increasing healthcare expenditures, a rising prevalence of chronic diseases like cancer and diabetes, and the shift towards digital X-ray technology. In the US, the adoption of digital X-ray equipment is on the rise due to Medicare's reimbursement cuts on analog X-ray equipment, which now receive only 80% of the original payment. Additionally, the presence of radiology associations is fostering market growth. Advanced technologies such as real-time imaging, big data analytics, artificial intelligence, and machine learning are revolutionizing diagnostic imaging, leading to improved patient care and precision medicine.
Digital radiography, image enhancement, and high-resolution imaging are gaining popularity, while image processing, patient safety, and quality control remain top priorities. Furthermore, the integration of cloud computing, mobile imaging, and remote imaging is enabling healthcare providers to access and analyze medical images from anywhere, at any time. Non-destructive testing and industrial X-ray applications are also contributing to the market's growth. Computed tomography, 3D imaging, and contrast agents are essential tools in advanced imaging, while regulatory compliance, radiation shielding, and image quality are critical concerns. Overall, the market in North America is evolving rapidly, with a focus on innovation, patient care, and regulatory adherence.
Market Dynamics
Our researchers analyzed the data with 2024 as the base year, along with the key drivers, trends, and challenges. A holistic analysis of drivers will help companies refine their marketing strategies to gain a competitive advantage.
What are the key market drivers leading to the rise in the adoption of X-Ray Equipment Industry?
- The rising prevalence of chronic diseases serves as the primary market catalyst. The market is experiencing significant growth due to the increasing prevalence of chronic diseases that necessitate frequent diagnostic imaging. Chronic conditions such as cancer, cardiovascular diseases, and respiratory diseases require various diagnostic imaging techniques, including X-rays. The rise in the number of people diagnosed with these diseases is driving the demand for advanced X-ray equipment. Factors contributing to the increasing incidence of chronic diseases include sedentary lifestyles, environmental issues, lack of physical activity, overconsumption of alcohol, tobacco smoking, obesity, and unhealthy eating habits. The most common chronic diseases affecting the elderly population are hypertension, spinal abnormalities, cardiovascular diseases, gastrointestinal diseases, urological diseases, diabetes, cancer, and orthopedic deformities.
- Advancements in technology have led to the development of innovative X-ray equipment, such as digital radiography, real-time imaging, and image analysis systems. These technologies enable personalized medicine and improve diagnostic accuracy. Furthermore, the integration of big data analytics, artificial intelligence, and machine learning in diagnostic imaging systems enhances the ability to analyze complex medical data and provide accurate diagnoses. These advancements are expected to further fuel the growth of the market.
What are the market trends shaping the X-Ray Equipment Industry?
- The trend in the market is being shaped by technological advances. It is essential to stay informed about the latest innovations to remain competitive. The market experiences significant growth due to the continuous advancements in imaging technology. Radiation therapy applications, including chest, neck/spine, limbs, dental, mammography, ICU, neonatal ICU, and hospital wards, benefit from these technological innovations. New products, such as those utilizing neutrons and advanced radiation sources, are driving market expansion. The shift from analog to digital X-rays has resulted in improved efficiency and image quality through the use of flat-panel CR in X-ray machines. Digital imaging, which replaced conventional film-based radiography, has revolutionized the industry by offering enhanced capabilities and applications.
- Regulatory compliance, radiation shielding, remote imaging, and non-destructive testing are essential considerations in the development and implementation of these advanced technologies. Additionally, cloud computing solutions enable seamless data storage, access, and sharing, further enhancing the value proposition of X-ray equipment.
What challenges does the X-Ray Equipment Industry face during its growth?
- The high cost of X-ray equipment poses a significant challenge to the growth of the industry, as this essential technology comes with a substantial investment for healthcare providers and diagnostic centers. The high cost of X-ray equipment, including support services, can make diagnostic tests expensive, limiting patient access due to affordability. However, the high cost of X-ray equipment and associated services, such as image enhancement, mobile imaging, and image processing, can hinder affordability for patients and businesses. The price of X-ray equipment varies significantly, with an average cost of USD 57,875 for an analog portable unit, USD 75,000 for a single-panel digital unit, and USD 105,000 for a dual-panel digital unit. In contrast, a digital portable unit with flat-panel detectors can cost up to USD 180,159.
- These expenses include radiologist fees, equipment fees, hospital fees, and inpatient imaging fees. The advancements in technology continue to drive up the cost of X-ray equipment, making it a significant investment for patient safety and diagnostic accuracy.
Exclusive Customer Landscape
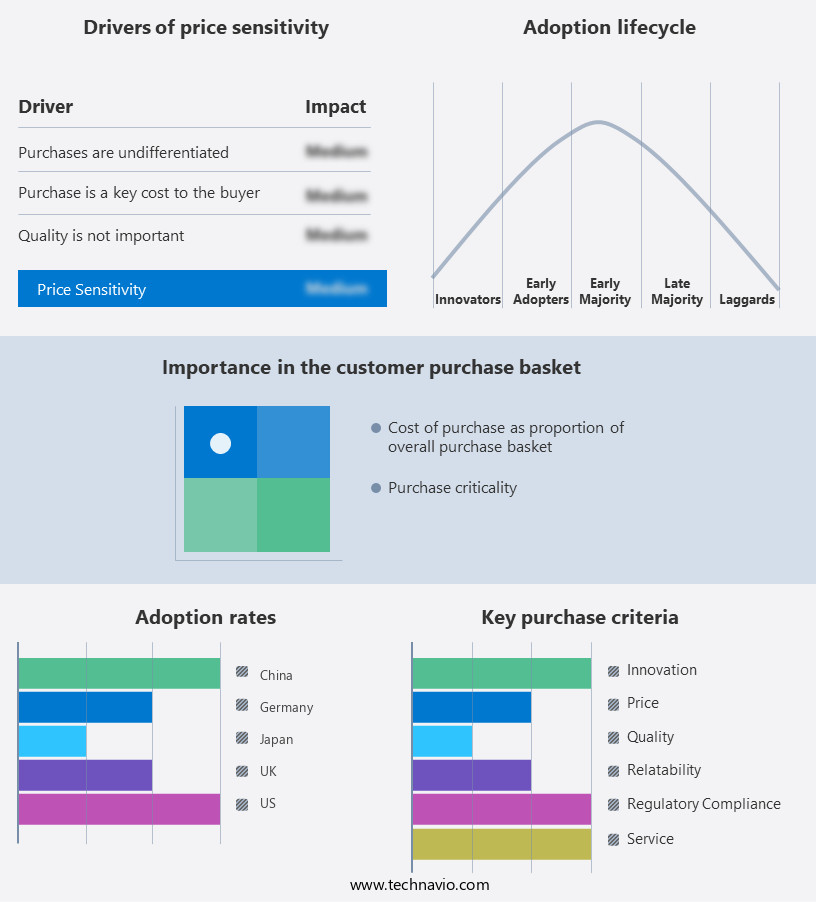
The X-ray equipment market forecasting report includes the adoption lifecycle of the market, covering from the innovator's stage to the laggard's stage. It focuses on adoption rates in different regions based on penetration. Furthermore, the X-ray equipment market report also includes key purchase criteria and drivers of price sensitivity to help companies evaluate and develop their market growth analysis strategies.
Customer Landscape
Key Companies & Market Insights
Companies are implementing various strategies, such as strategic alliances, x-ray equipment market forecast, partnerships, mergers and acquisitions, geographical expansion, and product/service launches, to enhance their presence in the industry.
Agfa Gevaert NV - The company offers X-ray equipment such as DR 100s, DX-D 300, DR 400, DR 600 and DR 800.
The industry research and growth report includes detailed analyses of the competitive landscape of the market and information about key companies, including:
- Agfa Gevaert NV
- Canon Inc.
- Carestream Health Inc.
- DURR NDT GmbH and Co. KG
- Finapoline SAS
- FUJIFILM Holdings Corp.
- GE Healthcare Technologies Inc.
- Hitachi Ltd.
- Hologic Inc.
- Konica Minolta Inc.
- Koninklijke Philips NV
- Shenzhen Mindray BioMedical Electronics Co. Ltd.
- MinXray Inc.
- New Medical Imaging Co ltd
- Samsung Electronics Co. Ltd.
- Shimadzu Corp.
- Siemens Healthineers AG
- Toshiba Corp.
- Varex Imaging Corp.
Qualitative and quantitative analysis of companies has been conducted to help clients understand the wider business environment as well as the strengths and weaknesses of key industry players. Data is qualitatively analyzed to categorize companies as pure play, category-focused, industry-focused, and diversified; it is quantitatively analyzed to categorize companies as dominant, leading, strong, tentative, and weak.
Recent Development and News in X-Ray Equipment Market
- In February 2024, Philips, a leading health technology company, unveiled its new generation of mobile X-ray systems, the Mobiles Dawn MDR-F15, at the European Congress of Radiology. This innovative product launch features advanced imaging technology and improved mobility, making it easier for healthcare providers to deliver high-quality diagnostic services in various settings (Philips, 2024).
- In June 2025, Siemens Healthineers and Microsoft Corporation announced a strategic collaboration to develop and implement AI-powered solutions for medical imaging, including X-ray equipment. This partnership aims to enhance diagnostic accuracy and efficiency by integrating Microsoft's Azure AI platform with Siemens Healthineers' imaging systems (Siemens Healthineers, 2025).
- In September 2024, Canon Medical Systems Corporation completed the acquisition of Toshiba Medical Systems Corporation's X-ray business. This significant merger expanded Canon Medical Systems' product portfolio and strengthened its position in the market (Canon Medical Systems, 2024).
- In November 2025, the US Food and Drug Administration (FDA) approved the marketing of GE Healthcare's new portable X-ray system, the DXC-840. This approval marks the first time the FDA has cleared a portable X-ray system with advanced imaging capabilities and a rechargeable battery, enabling greater mobility and flexibility for healthcare providers (GE Healthcare, 2025).
Research Analyst Overview
The market encompasses a range of technologies and applications, including disease management, diagnosis, treatment delivery, image-guided surgery, radiation oncology, and interventional radiology. Quality assurance plays a crucial role in ensuring the accuracy and reliability of these systems, with dose planning, image fusion, radiotherapy simulation, and patient positioning being key components. Biomedical engineering advances continue to drive innovation in this field, with developments in stereotactic radiosurgery, medical device development, imaging biomarkers, and image-guided therapy. Radiation safety and patient monitoring are also paramount, with ultrasound imaging and imaging protocols essential for optimizing patient care.
In the realm of radiation oncology, radiation safety and patient monitoring are integral to effective treatment delivery. Image-guided therapy and interventional radiology procedures rely on real-time imaging and precise patient positioning for optimal outcomes. The integration of these technologies is transforming healthcare, enabling more accurate diagnoses, personalized treatment plans, and improved patient outcomes.
Dive into Technavio's robust research methodology, blending expert interviews, extensive data synthesis, and validated models for unparalleled X-Ray Equipment Market insights. See full methodology.
|
Market Scope |
|
|
Report Coverage |
Details |
|
Page number |
226 |
|
Base year |
2024 |
|
Historic period |
2019-2023 |
|
Forecast period |
2025-2029 |
|
Growth momentum & CAGR |
Accelerate at a CAGR of 6% |
|
Market growth 2025-2029 |
USD 4.17 billion |
|
Market structure |
Fragmented |
|
YoY growth 2024-2025(%) |
5.6 |
|
Key countries |
US, Germany, UK, Canada, Japan, Brazil, China, France, Italy, and India |
|
Competitive landscape |
Leading Companies, Market Positioning of Companies, Competitive Strategies, and Industry Risks |
What are the Key Data Covered in this X-Ray Equipment Market Research and Growth Report?
- CAGR of the X-Ray Equipment industry during the forecast period
- Detailed information on factors that will drive the growth and forecasting between 2025 and 2029
- Precise estimation of the size of the market and its contribution of the industry in focus to the parent market
- Accurate predictions about upcoming growth and trends and changes in consumer behaviour
- Growth of the market across North America, Europe, Asia, and Rest of World (ROW)
- Thorough analysis of the market's competitive landscape and detailed information about companies
- Comprehensive analysis of factors that will challenge the x-ray equipment market growth and forecasting
We can help! Our analysts can customize this x-ray equipment market research report to meet your requirements.
 RIA -
RIA - 
